IMAGE

Figure 5

ID
ZDB-IMAGE-241019-54
Source
Figures for Wijerathna et al., 2024
Image
Figure Caption

Figure 5

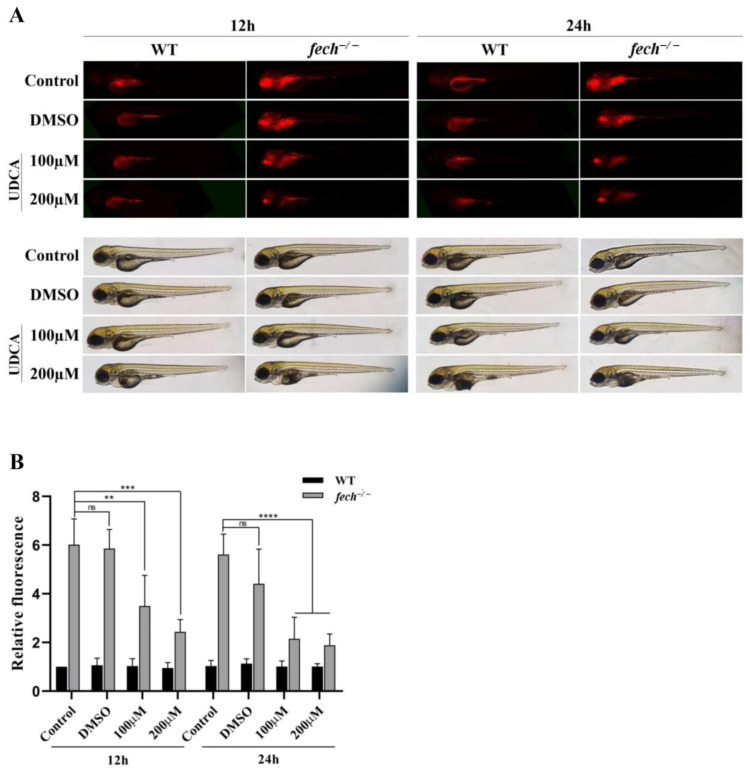
Reduction in PPIX accumulation in fech−/− larvae following UDCA treatment. WT and fech−/− larvae (3 dpf) were treated with 100 or 200 µM of UDCA, and their PPIX fluorescence intensity was compared with that of untreated WT and fech−/− larvae. (A) Fluorescence and bright-field images of WT and fech−/− larvae after UDCA treatment as well as the controls. (B) The relative fluorescence intensities of PPIX in the experimental larvae. The relative fluorescence intensity data are presented as the means ± SD (n = 5). The statistical significance between control and treated larvae was analyzed using the Student’s t-test (ns, non-significant; **, p ≤ 0.01; ***, p ≤ 0.001; ****, p ≤ 0.0001).

Acknowledgments
This image is the copyrighted work of the attributed author or publisher, and ZFIN has permission only to display this image to its users. Additional permissions should be obtained from the applicable author or publisher of the image. Full text @ Int. J. Mol. Sci.