
- Title
-
Endolysosomal dysfunction in radial glia progenitor cells leads to defective cerebral angiogenesis and compromised blood-brain barrier integrity
- Authors
- Bassi, I., Grunspan, M., Hen, G., Ravichandran, K.A., Moshe, N., Gutierrez-Miranda, L., Safriel, S.R., Kostina, D., Shen, A., Ruiz de Almodovar, C., Yaniv, K.
- Source
- Full text @ Nat. Commun.
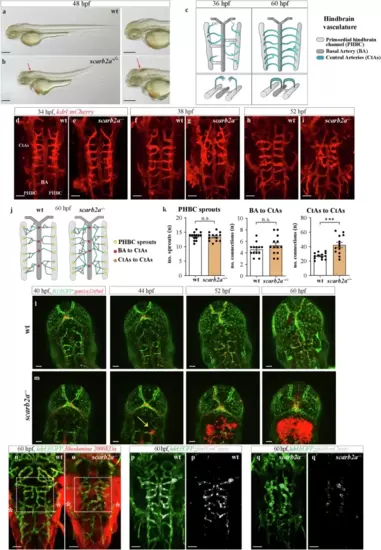
scarb2a mutants feature impaired cerebral angiogenesis and dysfunctional BBB.a, b Brightfield images of wild-type (wt) and scarb2a?/? embryos at 48 hpf depicting morphological defects and intraventricular hemorrhage (b, arrow) in the mutants (Nexperiments=3, for each nwt = 10, nscarb2a?/?= 10). c Schematic diagram illustrating dorsal views of the developing zebrafish hindbrain vasculature and its different components, as shown in d?i. d?i Confocal images of Tg(kdrl:mCherry) wt and scarb2a?/? at 34 (d, e), 38 (f, g) and 52 (h, i) hpf, showing increasing defects in the morphology and patterning of mutant CtAs, starting at 38 hpf (for each developmental stage Nexperiments = 3, nwt = 12, nscarb2a?/?=12). j Schematic reconstruction of wt and scarb2a?/? hindbrain vasculature at 60 hpf depicting parameters quantified in k. k Quantification at 60 hpf shows no differences in CtA sprouting from the PHBCs or CtA connections to the BA, but increased numbers of CtAs interconnections (n = 13 embryos, two-tailed Student?s t-test, PPHBC = 0.46, PBA = 0.1214, PCTAs = 0.0038) in mutant hindbrains. l, m Selected confocal images from a time-lapse series of Tg(fli1:EGFP;gata1a:DsRed) wt and scarb2a?/? show extravasation of red blood cells (RBCs) from the CtAs in the mutants, starting at ~44 hpf (m, arrow, Nexperiments = 3, for each nwt = 1, nscarb2a?/?=1). n, o Intravascular injection of Rhodamine Dextran 2000 KDa at 60 hpf demonstrates compromised integrity and enhanced permeability of BBB vessels in mutant embryos (* mark unspecific dye accumulation in the skin, Nexperiments = 3, for each nwt = 5, nscarb2a?/?=5). p, q' Confocal images of Tg(kdrl:EGFP;glut1b:mCherry) show strong downregulation of glut1b expression in scarb2a mutants (co-localization channel shown in white, Nexperiments = 3, for each nwt = 6, nscarb2a?/?=6). CtAs central arteries, PHBC Primordial hindbrain channel, BA basal artery. Error bars are mean � s.e.m. *P < 0.05, ** P < 0.01, ***P < 0.001, ****P < 0.0001; ns, not statistically significant. Scale bars, a, b = 100 ?m; d?i; k, l; m, n; p, q?= 50 ?m. Source data are provided as a Source Data file. |
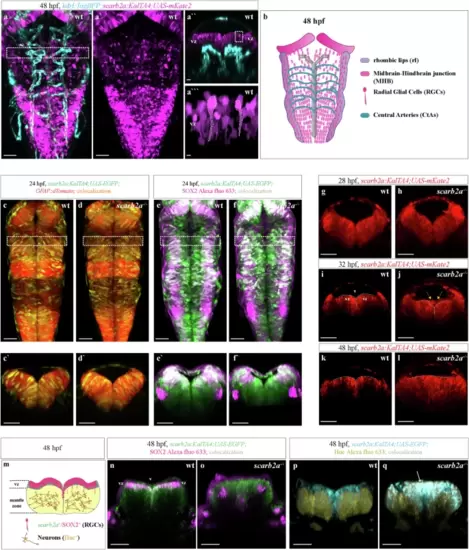
scarb2a is expressed in RGCs, and its depletion affects brain morphogenesis.a-a?, Confocal images of Tg(kdrl:TagBFP;scarb2a:KalTA4;UAS-mkate2) showing no colocalization of scarb2a (magenta) and the kdrl (blue) signals at 48 hpf (dashed square in a marks the region displayed in a?). a?, Transverse optical section at the level shown in a demonstrates the presence of scarb2a+ cells in the ventricular zone (vz; dashed square depicts the region enlarged in a??). a??, scarb2a+ cells (dashed lines) display morphology typical of RGCs (Nexperiments=3, for each nwt = 9, nscarb2a?/?=9). b Schematic illustration depicting the anatomical organization of RGCs and blood vessels in the zebrafish hindbrain at 48 hpf. c?d?, Dorsal views of wt and mutant hindbrains showing co-localization of Tg(scarb2a:KalTA4;UAS-EGFP) and Tg(GFAP:dTomato) signal in a subpopulation of RGCs (yellow channel denotes co-localization, dashed squares in c, d mark the level of the optical sections in c?, d?, Nexperiments = 3, for each nwt = 6, nscarb2a?/?=6). e?f? Dorsal views of wt and mutant hindbrains showing co-localization of Tg(scarb2a:KalTA4;UAS-EGFP) and SOX2 immunostaining in RGCs at the vz (co-localization depicted in white, dashed squares in e?f mark the level of the optical sections in e', f', Nexperiments = 3, for each nwt = 4, nscarb2a?/?=4). g?l Transverse optical sections from a time-lapse series of Tg(scarb2a:KalTA4;UAS-mkate2) in wt (g, i, k) and mutant (h, j, l) embryos. Images show gradual restriction of scarb2a expression to the vz at 28 (g, h), 32 (i, j), and 48 (k, l) hpf in wt fish. In mutant, scarb2a-labeled cells invade the ventricle space starting at 32 hpf (j?l, Nexperiments = 3, for each nwt = 1, nscarb2a?/?=1). m Schematic representation of the zebrafish hindbrain depicting organization of different cell types at 48 hpf. n, o Immunofluorescence staining of Tg(scarb2a:KalTA4;UAS-EGFP) at 48 hpf showing SOX2 expression in scarb2a+ RGCs in the vz of wt embryos (n, magenta), that is utterly absent in the vz of scarb2a mutants (o, Nexperiments = 3, for each nwt = 4, nscarb2a?/?=4). p, q, HuC immunostaining on Tg(scarb2a:KalTA4;UAS-EGFP) embryos at 48 hpf showing HuC+ cells in the mantle zone of wt embryos (p, yellow) and scarb2a+ RGCs in the vz (p, blue). In scarb2a mutants, scarb2a-labeled cells co-express HuC in the vz, mantle zone, and while invading the ventricular space (q, arrow), indicating a neuronal fate (white depicts co-localization channel, Nexperiments = 3, for each nwt = 3, nscarb2a?/?=3). Scale bars, a-a'=50 ?m; a"=25 ?m; a"'=5 ?m; c?f = 50 ?m; c'?f', g?l, n?q = 30 ?m. vz ventricular zone, v ventricle space. |
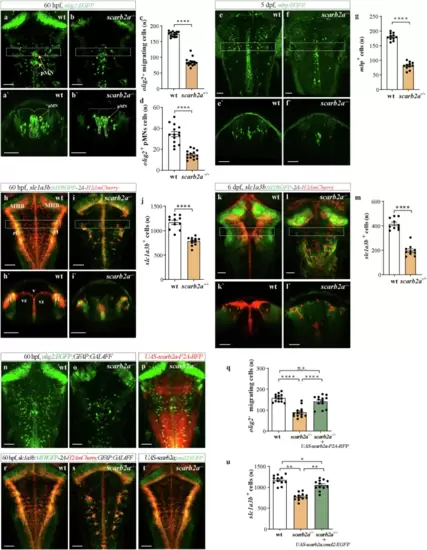
scarb2a depletion leads to impaired gliogenesis.a, b?, Dorsal views (a, b) and transverse optical sections (a?, b?) of Tg(olig2:EGFP) wt (a, a?) and scarb2a?/? (b, b?) at 60 hpf showing significant reduction of olig2+ migrating cells and in the pMN domain (dashed lines) in scarb2a mutants. (dashed squares in a, b mark the level of the optical sections showed in a?, b?). c Quantification of olig2+ migrating OPCs (n = 14 embryos, two-tailed Student?s t-test, P < 0.0001) and d olig2+ OPCs in the pMN domain (embryos n = 14 embryos, two-tailed Student?s t-test, P < 0.0001). e?f?, Dorsal views (e, f) and transverse optical sections (e?,f?) of Tg(mbp:EGFP) embryos at 5 dpf depicting reduced numbers of myelinating OLs in scarb2a?/?, quantified in (g) (n = 14 embryos, two-tailed Student?s t-test, P < 0.0001). h?i? Dorsal views (h, i) and transverse optical sections (h?, i?) of Tg(slc1a3b:MYRGFP-2A-H2AmCherry) x wt (h, h?) and scarb2a?/? (i, i?) showing significantly fewer astrocyte nuclei (red) in the vz of mutant hindbrains at 60 hpf (dashed squares in h, i mark the level of the optical sections shown in h?, i?), quantified in j (n = 11 embryos, two-tailed Student?s t-test, P < 0.0001). k?l', Dorsal views (k, l) and transverse optical sections (k', l') of Tg(slc1a3b:MYRGFP-2A-H2AmCherry) embryos at 6 dpf showing reduced numbers of astrocytes, quantified in m (n = 10 embryos, two-tailed Student?s t-test, P < 0.0001). n?p Dorsal views of Tg(olig2:EGFP;GFAP:Gal4FF) hindbrain in wt (n), scarb2a?/? (o), and scarb2a?/? mutant following injection of UAS-scarb2a-P2A-RFP (p). q Quantification of migrating olig2+ cells (n = 13 embryos; One-way ANOVA, multiple comparisons with Tukey posthoc test). r?t Dorsal views of Tg(slc1a3b:MYRGFP-2A-H2AmCherry;GFAP:Gal4FF) hindbrains in wt (r), scarb2a?/? (s) and scarb2a?/? mutant following injection of UAS-scarb2a,cmcl2:EGFP (t). u Quantification of slc1a3b+ red nuclei (n = 12 embryos; One-way ANOVA, multiple comparisons with Tukey posthoc test). Error bars are mean � s.e.m. *P < 0.05, **P < 0.01, ***P < 0.001, ****P < 0.0001; ns, not statistically significant. Scale bars, a, b, e, f, h, i, k, l, n?p, r?t = 50 ?m; a', b', e', f?, h', i', k', l' = 30 ?m. Source data are provided as a Source Data file. |
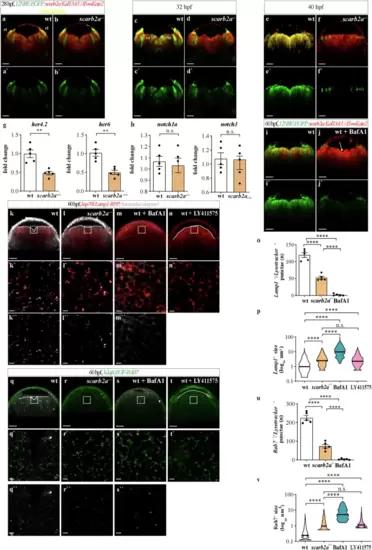
Impaired endolysosomal acidification results in Notch signaling inhibition in scarb2a mutant hindbrains.a?f' Optical transverse sections from a time-lapse series of Tg(12NRE:EGFP;scarb2a:KalTA4;UAS-mkate2) wt and mutant embryos at 28 (a?b'), 32 (c?d') and 40 hpf (e?f') showing reduced Notch signaling in scarb2a mutant vz starting from 32 hpf (d, d?; f, f?, Nexperiments = 3, for each nwt = 1, nscarb2a?/?=1). g-h qRT-PCR showing mRNA levels of her4.2, her6 (g) and notch1a, notch3 (h) in mKate2+ cells sorted from Tg(scarb2a:KalTA4;UAS-mkate2) heads (N = 5, n = pull of 20 embryos, two-tailed Student?s t-test, Pher4.2 = 0.0017; Pher6 = 0.0012,; Pnotch1a = 0.6586, Pnotch3 = 0.9277). i?j? Transverse optical sections of Tg(12NRE:EGFP;scarb2a:KalTA4;UAS-mkate2) wt embryos untreated (i, i?) or treated with the v-ATPase inhibitor Bafilomycin A1 (BafA1, j, j') showing intraventricular RGC invasion (j, arrow) and reduced Notch signaling in treated embryos (j?, Nexperiments = 3, for each nwt = 5, nBafA1-=5). k?l? Lysotracker Deep Red staining of Tg(hsp70l:lamp1-RFP) wt (k?k?) and scarb2a mutant (l?l?) embryos showing reduction of Lamp1+ acidic punctae in mutant hindbrains; quantified in o. m?n?, Transverse optical sections of Tg(hsp70l:lamp1-RFP) wt embryos treated with BafA1 (m?m?) or with the ?-secretase inhibitor (LY-411575) (n, n?, Nexperiments = 3, for each group n = 5 embryos). o Quantification of double-positive Lamp1/Lysotracker punctae (Nexperiments=3, n = 5 embryos/group, One-way ANOVA, multiple comparisons with Tukey posthoc test). p Quantification of Lamp1+ vesicle size in wt, scarb2a mutants, BafA1, and LY-411575 wt-treated embryos (Nexperiments=3,for each group n = 5 embryos, One-way ANOVA, multiple comparisons with Tukey posthoc test, PANOVA < 0.0001). q?r? Lysotracker Deep Red staining of Tg(h2afx:EGFP-RAB7) wt (q?q?) and scarb2a mutant (r?r?) embryos showing reduction of double positive Rab7/Lysotracker punctae in mutant hindbrains; quantified in (u, Nexperiments = 3, for each group n = 5 embryos, One-way ANOVA, multiple comparisons with Tukey posthoc test, PANOVA < 0.0001). s?t? Transverse optical sections of Tg(h2afx:EGFP-RAB7) wt embryos treated with BafA1 (s?s?, u) or LY-411575 (t, t?, Nexperiments = 3, n = 5 embryos/group). v Quantification of Rab7 vesicle size in wt, scarb2a mutants, BafA1, and LY -411575 wt-treated embryos (Nexperiments=3, n = 5 embryos/group, One-way ANOVA, multiple comparisons with Tukey posthoc test, PANOVA < 0.0001). g, h, o, u = Error bars are mean � s.e.m.; p, v = bars are median. *P < 0.05, **P < 0.01, ***P < 0.001, ****P < 0.0001; ns, not statistically significant. Scale bars, a?f', i?j?,k, l, m, n, q, r, s, t = 30 ?m; k?, l?, m?, n?, q?, r?, s?, t? = 5 ?m. Source data are provided as a Source Data file. |
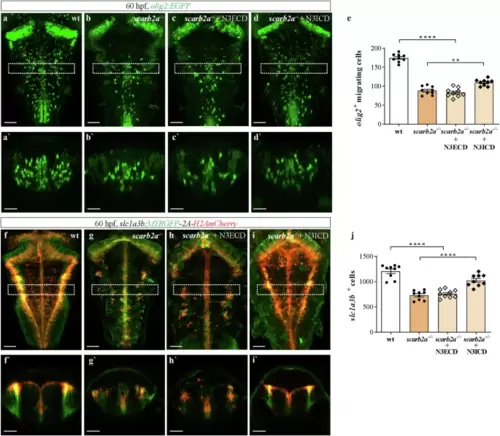
Overexpression of Notch3 intracellular (N3ICD) but not extracellular (N3ECD) domain rescues gliogenesis in scarb2a mutants.a?d? Dorsal views and transverse optical sections of Tg(olig2:EGFP) hindbrain in wt (a, a?), scarb2a?/? (b, b?) and scarb2a?/? following heat-shock induced overexpression of Notch3 extracellular (N3ECD) (c?c?) and Notch3 intracellular (N3ICD) domains (d?d') (dashed square in a?d, marks the region shown in a??d?). e Quantification of migrating OPCs in a?d (n = 9 embryos, One-way ANOVA, multiple comparisons with Tukey post-hoc test, PANOVA < 0.0001). f?i? Dorsal views and transverse optical sections of Tg(slc1a3b:MYRGFP-2A-H2AmCherry) hindbrains in wt (f), scarb2a?/? (g) and scarb2a?/? mutant following N3ECD (h-h?) or N3ICD (i?i?), heat-shock induction (dashed square in f?i, marks the region shown in f??i?) j, Quantification of slc1a3b+ astrocytes in f?i (n = 9 embryos, One-way ANOVA, multiple comparisons with Tukey posthoc test, PANOVA < 0.0001). Error bars are mean � s.e.m. *P < 0.05, **P < 0.01, ***P < 0.001, ****P < 0.0001; ns, not statistically significant. Scale bars, a?, b?, c?, d?, f?, g?, h?, i? = 30 ?m; a, b, c, d, f, g, h, i = 60 ?m.Source data are provided as a Source Data file. |
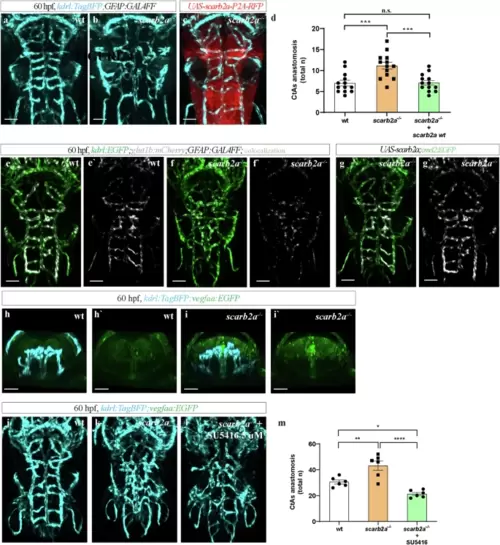
Restoring scarb2a expression in mutant RGCs rescues BBB development and integrity.a?c Dorsal views of the hindbrain vasculature in Tg(kdrl:TagBFP;GFAP:Gal4FF) embryos wt (a), scarb2a?/? (b) and scarb2a?/? mutant following injection of UAS-scarb2a-P2A-RFP (c). d Quantification of CtA interconnections (n = 13 embryos; One-way ANOVA, multiple comparisons with Tukey posthoc test, PANOVA < 0.0001). e?g? Dorsal views of Tg(kdrl:EGFP;glut1b:mCherry;GFAP:Gal4FF) depicting full restoration of glut1b expression (white) following injection of UAS-scarb2a,cmcl2:EGFP in mutant embryos (g, g?, Nexperiments = 3, for each nwt = 6, nscarb2a?/?=6). h?i' Transverse optical sections of kdrl:TagBFP;vegfaa:EGFP 60 hpf embryos showing increased Vegfa signal in scarb2a?/? (i, i', Nexperiments = 3, for each nwt = 5, nscarb2a?/?=5). j?l Dorsal views of Tg(kdrl:TagBFP) wt (j), scarb2a?/? (k) and scarb2a?/? after treatment with the Vegfr inhibitor SU5416 (l). m Quantification of CtA anastomoses following SU5416 treatment (n = 6 embryos; One-way ANOVA, multiple comparisons with Tukey posthoc test, PANOVA < 0.0001). Error bars are mean � s.e.m. *P < 0.05, **P < 0.01, ***P < 0.001; ***P < 0.001 ns, not statistically significant. Scale bars, a?c; e?g' = 60 ?m; h-i? = 30 ?m. Source data are provided as a Source Data file. |
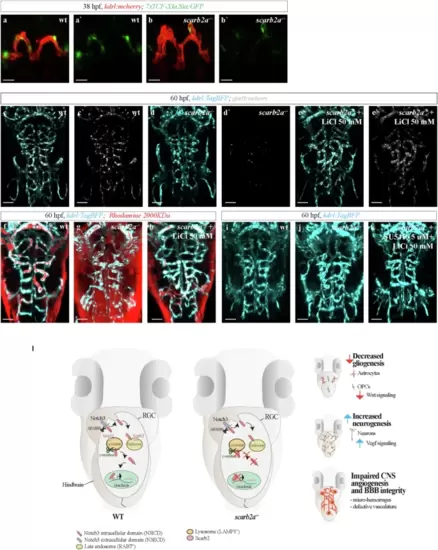
Reduced Wnt/?-catenin signaling in scarb2a?/? ECs, results in abnormal CtA anastomosis and dysfunctional BBB.a?b', Optical transverse sections of Tg(kdrl:mcherry;7xTCF-Xla.Sia:GFP) in wt (a, a') and scarb2a?/? (b, b') showing reduced Wnt activity in ECs of scarb2a?/? (b, b', Nexperiments = 3, for each nwt = 3, nscarb2a?/?=3). c?e', Dorsal views of Tg(kdrl:TagBFP;glut1b:mCherry) depicting normalized glut1b expression (white) following treatment with LiCl (e, e', Nexperiments = 3, for each nwt = 6, nscarb2a?/?=6). f?h LiCl treatment significantly reduces leakage of 2000KDa Rhodamine from scarb2a?/? hindbrain vessels (h, Nexperiments = 3, for each nwt = 4, nscarb2a?/?=4). i?k Confocal images of Tg(kdrl:TagBFP) showing complete restoration of the brain vascular network after administration of LiCL and SU5416 to scarb2a mutants (k, Nexperiments = 3, for each nwt = 4, nscarb2a?/?=4). l Graphical model depicting the series of events affecting NVU formation and function in scarb2a mutant embryos. Defective endolysosomal acidification hinders Notch3 processing in RGCs, leading to imbalanced neurogenesis vs. gliogenesis, altered levels of Vegf and Wnt activation, which in turn result in defective cerebral angiogenesis, micro-hemorrhages, and compromised BBB. Scale bars a?b' = 30 ?m; c?k = 60 ?m. |