
Fig. 6
- ID
- ZDB-FIG-240918-58
- Publication
- Bassi et al., 2024 - Endolysosomal dysfunction in radial glia progenitor cells leads to defective cerebral angiogenesis and compromised blood-brain barrier integrity
- Other Figures
- All Figure Page
- Back to All Figure Page
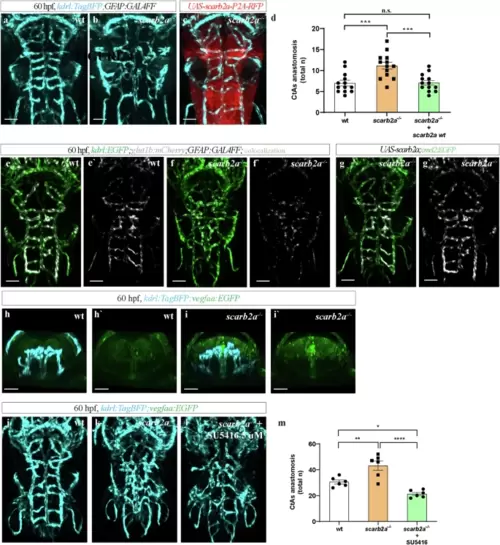
Restoring scarb2a expression in mutant RGCs rescues BBB development and integrity.a–c Dorsal views of the hindbrain vasculature in Tg(kdrl:TagBFP;GFAP:Gal4FF) embryos wt (a), scarb2a−/− (b) and scarb2a−/− mutant following injection of UAS-scarb2a-P2A-RFP (c). d Quantification of CtA interconnections (n = 13 embryos; One-way ANOVA, multiple comparisons with Tukey posthoc test, PANOVA < 0.0001). e–g’ Dorsal views of Tg(kdrl:EGFP;glut1b:mCherry;GFAP:Gal4FF) depicting full restoration of glut1b expression (white) following injection of UAS-scarb2a,cmcl2:EGFP in mutant embryos (g, g’, Nexperiments = 3, for each nwt = 6, nscarb2a−/−=6). h–i' Transverse optical sections of kdrl:TagBFP;vegfaa:EGFP 60 hpf embryos showing increased Vegfa signal in scarb2a−/− (i, i', Nexperiments = 3, for each nwt = 5, nscarb2a−/−=5). j–l Dorsal views of Tg(kdrl:TagBFP) wt (j), scarb2a−/− (k) and scarb2a−/− after treatment with the Vegfr inhibitor SU5416 (l). m Quantification of CtA anastomoses following SU5416 treatment (n = 6 embryos; One-way ANOVA, multiple comparisons with Tukey posthoc test, PANOVA < 0.0001). Error bars are mean ± s.e.m. *P < 0.05, **P < 0.01, ***P < 0.001; ***P < 0.001 ns, not statistically significant. Scale bars, a–c; e–g' = 60 μm; h-i’ = 30 μm. Source data are provided as a Source Data file. |