
Fig. 3
- ID
- ZDB-FIG-240918-55
- Publication
- Bassi et al., 2024 - Endolysosomal dysfunction in radial glia progenitor cells leads to defective cerebral angiogenesis and compromised blood-brain barrier integrity
- Other Figures
- All Figure Page
- Back to All Figure Page
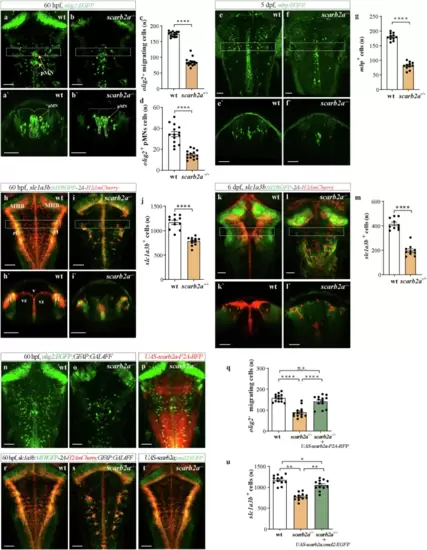
scarb2a depletion leads to impaired gliogenesis.a, b’, Dorsal views (a, b) and transverse optical sections (a’, b’) of Tg(olig2:EGFP) wt (a, a’) and scarb2a−/− (b, b’) at 60 hpf showing significant reduction of olig2+ migrating cells and in the pMN domain (dashed lines) in scarb2a mutants. (dashed squares in a, b mark the level of the optical sections showed in a’, b’). c Quantification of olig2+ migrating OPCs (n = 14 embryos, two-tailed Student’s t-test, P < 0.0001) and d olig2+ OPCs in the pMN domain (embryos n = 14 embryos, two-tailed Student’s t-test, P < 0.0001). e–f’, Dorsal views (e, f) and transverse optical sections (e’,f’) of Tg(mbp:EGFP) embryos at 5 dpf depicting reduced numbers of myelinating OLs in scarb2a−/−, quantified in (g) (n = 14 embryos, two-tailed Student’s t-test, P < 0.0001). h–i’ Dorsal views (h, i) and transverse optical sections (h’, i’) of Tg(slc1a3b:MYRGFP-2A-H2AmCherry) x wt (h, h’) and scarb2a−/− (i, i’) showing significantly fewer astrocyte nuclei (red) in the vz of mutant hindbrains at 60 hpf (dashed squares in h, i mark the level of the optical sections shown in h’, i’), quantified in j (n = 11 embryos, two-tailed Student’s t-test, P < 0.0001). k–l', Dorsal views (k, l) and transverse optical sections (k', l') of Tg(slc1a3b:MYRGFP-2A-H2AmCherry) embryos at 6 dpf showing reduced numbers of astrocytes, quantified in m (n = 10 embryos, two-tailed Student’s t-test, P < 0.0001). n–p Dorsal views of Tg(olig2:EGFP;GFAP:Gal4FF) hindbrain in wt (n), scarb2a−/− (o), and scarb2a−/− mutant following injection of UAS-scarb2a-P2A-RFP (p). q Quantification of migrating olig2+ cells (n = 13 embryos; One-way ANOVA, multiple comparisons with Tukey posthoc test). r–t Dorsal views of Tg(slc1a3b:MYRGFP-2A-H2AmCherry;GFAP:Gal4FF) hindbrains in wt (r), scarb2a−/− (s) and scarb2a−/− mutant following injection of UAS-scarb2a,cmcl2:EGFP (t). u Quantification of slc1a3b+ red nuclei (n = 12 embryos; One-way ANOVA, multiple comparisons with Tukey posthoc test). Error bars are mean ± s.e.m. *P < 0.05, **P < 0.01, ***P < 0.001, ****P < 0.0001; ns, not statistically significant. Scale bars, a, b, e, f, h, i, k, l, n–p, r–t = 50 μm; a', b', e', f’, h', i', k', l' = 30 μm. Source data are provided as a Source Data file. |