
Fig. 4
- ID
- ZDB-FIG-240918-56
- Publication
- Bassi et al., 2024 - Endolysosomal dysfunction in radial glia progenitor cells leads to defective cerebral angiogenesis and compromised blood-brain barrier integrity
- Other Figures
- All Figure Page
- Back to All Figure Page
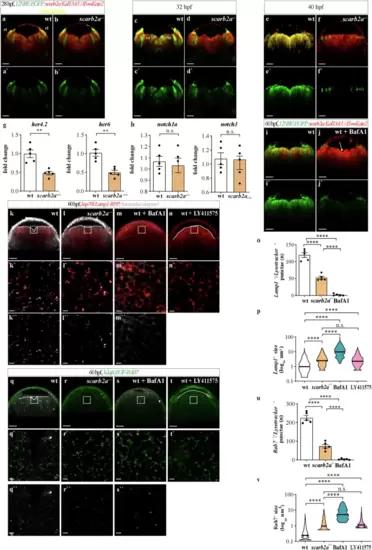
Impaired endolysosomal acidification results in Notch signaling inhibition in scarb2a mutant hindbrains.a–f' Optical transverse sections from a time-lapse series of Tg(12NRE:EGFP;scarb2a:KalTA4;UAS-mkate2) wt and mutant embryos at 28 (a–b'), 32 (c–d') and 40 hpf (e–f') showing reduced Notch signaling in scarb2a mutant vz starting from 32 hpf (d, d’; f, f’, Nexperiments = 3, for each nwt = 1, nscarb2a−/−=1). g-h qRT-PCR showing mRNA levels of her4.2, her6 (g) and notch1a, notch3 (h) in mKate2+ cells sorted from Tg(scarb2a:KalTA4;UAS-mkate2) heads (N = 5, n = pull of 20 embryos, two-tailed Student’s t-test, Pher4.2 = 0.0017; Pher6 = 0.0012,; Pnotch1a = 0.6586, Pnotch3 = 0.9277). i–j’ Transverse optical sections of Tg(12NRE:EGFP;scarb2a:KalTA4;UAS-mkate2) wt embryos untreated (i, i’) or treated with the v-ATPase inhibitor Bafilomycin A1 (BafA1, j, j') showing intraventricular RGC invasion (j, arrow) and reduced Notch signaling in treated embryos (j’, Nexperiments = 3, for each nwt = 5, nBafA1-=5). k–l” Lysotracker Deep Red staining of Tg(hsp70l:lamp1-RFP) wt (k–k”) and scarb2a mutant (l–l”) embryos showing reduction of Lamp1+ acidic punctae in mutant hindbrains; quantified in o. m–n’, Transverse optical sections of Tg(hsp70l:lamp1-RFP) wt embryos treated with BafA1 (m–m”) or with the γ-secretase inhibitor (LY-411575) (n, n’, Nexperiments = 3, for each group n = 5 embryos). o Quantification of double-positive Lamp1/Lysotracker punctae (Nexperiments=3, n = 5 embryos/group, One-way ANOVA, multiple comparisons with Tukey posthoc test). p Quantification of Lamp1+ vesicle size in wt, scarb2a mutants, BafA1, and LY-411575 wt-treated embryos (Nexperiments=3,for each group n = 5 embryos, One-way ANOVA, multiple comparisons with Tukey posthoc test, PANOVA < 0.0001). q–r’ Lysotracker Deep Red staining of Tg(h2afx:EGFP-RAB7) wt (q–q”) and scarb2a mutant (r–r”) embryos showing reduction of double positive Rab7/Lysotracker punctae in mutant hindbrains; quantified in (u, Nexperiments = 3, for each group n = 5 embryos, One-way ANOVA, multiple comparisons with Tukey posthoc test, PANOVA < 0.0001). s–t’ Transverse optical sections of Tg(h2afx:EGFP-RAB7) wt embryos treated with BafA1 (s–s”, u) or LY-411575 (t, t’, Nexperiments = 3, n = 5 embryos/group). v Quantification of Rab7 vesicle size in wt, scarb2a mutants, BafA1, and LY -411575 wt-treated embryos (Nexperiments=3, n = 5 embryos/group, One-way ANOVA, multiple comparisons with Tukey posthoc test, PANOVA < 0.0001). g, h, o, u = Error bars are mean ± s.e.m.; p, v = bars are median. *P < 0.05, **P < 0.01, ***P < 0.001, ****P < 0.0001; ns, not statistically significant. Scale bars, a–f', i–j’,k, l, m, n, q, r, s, t = 30 μm; k’, l’, m’, n’, q’, r’, s’, t’ = 5 μm. Source data are provided as a Source Data file. |