
Fig. 1
- ID
- ZDB-FIG-240918-53
- Publication
- Bassi et al., 2024 - Endolysosomal dysfunction in radial glia progenitor cells leads to defective cerebral angiogenesis and compromised blood-brain barrier integrity
- Other Figures
- All Figure Page
- Back to All Figure Page
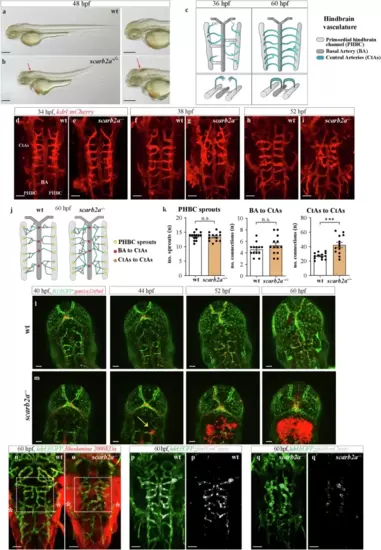
scarb2a mutants feature impaired cerebral angiogenesis and dysfunctional BBB.a, b Brightfield images of wild-type (wt) and scarb2a−/− embryos at 48 hpf depicting morphological defects and intraventricular hemorrhage (b, arrow) in the mutants (Nexperiments=3, for each nwt = 10, nscarb2a−/−= 10). c Schematic diagram illustrating dorsal views of the developing zebrafish hindbrain vasculature and its different components, as shown in d–i. d–i Confocal images of Tg(kdrl:mCherry) wt and scarb2a−/− at 34 (d, e), 38 (f, g) and 52 (h, i) hpf, showing increasing defects in the morphology and patterning of mutant CtAs, starting at 38 hpf (for each developmental stage Nexperiments = 3, nwt = 12, nscarb2a−/−=12). j Schematic reconstruction of wt and scarb2a−/− hindbrain vasculature at 60 hpf depicting parameters quantified in k. k Quantification at 60 hpf shows no differences in CtA sprouting from the PHBCs or CtA connections to the BA, but increased numbers of CtAs interconnections (n = 13 embryos, two-tailed Student’s t-test, PPHBC = 0.46, PBA = 0.1214, PCTAs = 0.0038) in mutant hindbrains. l, m Selected confocal images from a time-lapse series of Tg(fli1:EGFP;gata1a:DsRed) wt and scarb2a−/− show extravasation of red blood cells (RBCs) from the CtAs in the mutants, starting at ~44 hpf (m, arrow, Nexperiments = 3, for each nwt = 1, nscarb2a−/−=1). n, o Intravascular injection of Rhodamine Dextran 2000 KDa at 60 hpf demonstrates compromised integrity and enhanced permeability of BBB vessels in mutant embryos (* mark unspecific dye accumulation in the skin, Nexperiments = 3, for each nwt = 5, nscarb2a−/−=5). p, q' Confocal images of Tg(kdrl:EGFP;glut1b:mCherry) show strong downregulation of glut1b expression in scarb2a mutants (co-localization channel shown in white, Nexperiments = 3, for each nwt = 6, nscarb2a−/−=6). CtAs central arteries, PHBC Primordial hindbrain channel, BA basal artery. Error bars are mean ± s.e.m. *P < 0.05, ** P < 0.01, ***P < 0.001, ****P < 0.0001; ns, not statistically significant. Scale bars, a, b = 100 μm; d–i; k, l; m, n; p, q‘= 50 μm. Source data are provided as a Source Data file. |