
Fig. 2
- ID
- ZDB-FIG-240918-54
- Publication
- Bassi et al., 2024 - Endolysosomal dysfunction in radial glia progenitor cells leads to defective cerebral angiogenesis and compromised blood-brain barrier integrity
- Other Figures
- All Figure Page
- Back to All Figure Page
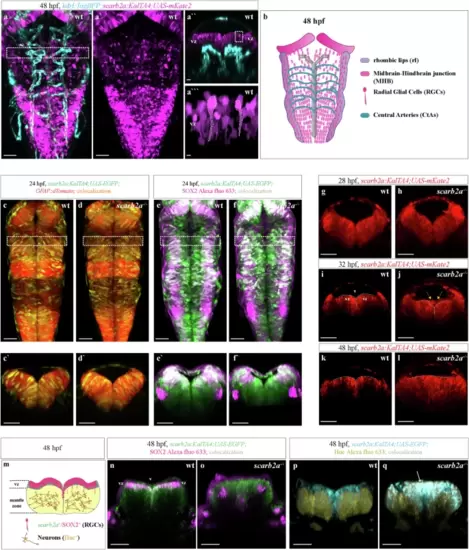
scarb2a is expressed in RGCs, and its depletion affects brain morphogenesis.a-a‘, Confocal images of Tg(kdrl:TagBFP;scarb2a:KalTA4;UAS-mkate2) showing no colocalization of scarb2a (magenta) and the kdrl (blue) signals at 48 hpf (dashed square in a marks the region displayed in a”). a”, Transverse optical section at the level shown in a demonstrates the presence of scarb2a+ cells in the ventricular zone (vz; dashed square depicts the region enlarged in a”’). a”’, scarb2a+ cells (dashed lines) display morphology typical of RGCs (Nexperiments=3, for each nwt = 9, nscarb2a−/−=9). b Schematic illustration depicting the anatomical organization of RGCs and blood vessels in the zebrafish hindbrain at 48 hpf. c–d‘, Dorsal views of wt and mutant hindbrains showing co-localization of Tg(scarb2a:KalTA4;UAS-EGFP) and Tg(GFAP:dTomato) signal in a subpopulation of RGCs (yellow channel denotes co-localization, dashed squares in c, d mark the level of the optical sections in c’, d’, Nexperiments = 3, for each nwt = 6, nscarb2a−/−=6). e–f’ Dorsal views of wt and mutant hindbrains showing co-localization of Tg(scarb2a:KalTA4;UAS-EGFP) and SOX2 immunostaining in RGCs at the vz (co-localization depicted in white, dashed squares in e–f mark the level of the optical sections in e', f', Nexperiments = 3, for each nwt = 4, nscarb2a−/−=4). g–l Transverse optical sections from a time-lapse series of Tg(scarb2a:KalTA4;UAS-mkate2) in wt (g, i, k) and mutant (h, j, l) embryos. Images show gradual restriction of scarb2a expression to the vz at 28 (g, h), 32 (i, j), and 48 (k, l) hpf in wt fish. In mutant, scarb2a-labeled cells invade the ventricle space starting at 32 hpf (j–l, Nexperiments = 3, for each nwt = 1, nscarb2a−/−=1). m Schematic representation of the zebrafish hindbrain depicting organization of different cell types at 48 hpf. n, o Immunofluorescence staining of Tg(scarb2a:KalTA4;UAS-EGFP) at 48 hpf showing SOX2 expression in scarb2a+ RGCs in the vz of wt embryos (n, magenta), that is utterly absent in the vz of scarb2a mutants (o, Nexperiments = 3, for each nwt = 4, nscarb2a−/−=4). p, q, HuC immunostaining on Tg(scarb2a:KalTA4;UAS-EGFP) embryos at 48 hpf showing HuC+ cells in the mantle zone of wt embryos (p, yellow) and scarb2a+ RGCs in the vz (p, blue). In scarb2a mutants, scarb2a-labeled cells co-express HuC in the vz, mantle zone, and while invading the ventricular space (q, arrow), indicating a neuronal fate (white depicts co-localization channel, Nexperiments = 3, for each nwt = 3, nscarb2a−/−=3). Scale bars, a-a'=50 μm; a"=25 μm; a"'=5 μm; c–f = 50 μm; c'–f', g–l, n–q = 30 μm. vz ventricular zone, v ventricle space. |