
Fig. 5
- ID
- ZDB-FIG-240918-57
- Publication
- Bassi et al., 2024 - Endolysosomal dysfunction in radial glia progenitor cells leads to defective cerebral angiogenesis and compromised blood-brain barrier integrity
- Other Figures
- All Figure Page
- Back to All Figure Page
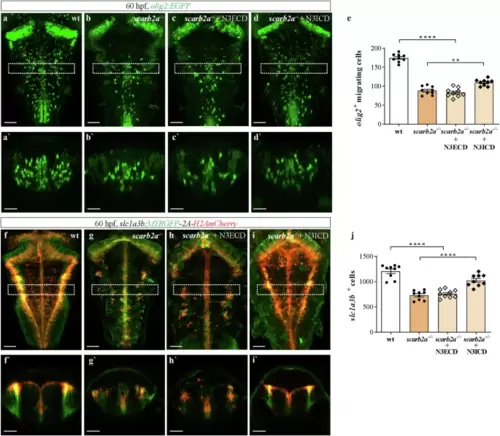
Overexpression of Notch3 intracellular (N3ICD) but not extracellular (N3ECD) domain rescues gliogenesis in scarb2a mutants.a–d’ Dorsal views and transverse optical sections of Tg(olig2:EGFP) hindbrain in wt (a, a’), scarb2a−/− (b, b’) and scarb2a−/− following heat-shock induced overexpression of Notch3 extracellular (N3ECD) (c–c‘) and Notch3 intracellular (N3ICD) domains (d–d') (dashed square in a–d, marks the region shown in a’–d’). e Quantification of migrating OPCs in a–d (n = 9 embryos, One-way ANOVA, multiple comparisons with Tukey post-hoc test, PANOVA < 0.0001). f–i’ Dorsal views and transverse optical sections of Tg(slc1a3b:MYRGFP-2A-H2AmCherry) hindbrains in wt (f), scarb2a−/− (g) and scarb2a−/− mutant following N3ECD (h-h’) or N3ICD (i–i’), heat-shock induction (dashed square in f–i, marks the region shown in f’–i’) j, Quantification of slc1a3b+ astrocytes in f–i (n = 9 embryos, One-way ANOVA, multiple comparisons with Tukey posthoc test, PANOVA < 0.0001). Error bars are mean ± s.e.m. *P < 0.05, **P < 0.01, ***P < 0.001, ****P < 0.0001; ns, not statistically significant. Scale bars, a’, b’, c’, d’, f’, g’, h’, i’ = 30 μm; a, b, c, d, f, g, h, i = 60 μm.Source data are provided as a Source Data file. |