
- Title
-
Shikonin, a natural naphthoquinone phytochemical, exerts anti-leukemia effects in human CBF-AML cell lines and zebrafish xenograft models
- Authors
- Yen, J.H., Keak, P.Y., Wu, C.L., Chen, H.J., Gao, W.Y., Liou, J.W., Chen, Y.R., Lin, L.I., Chen, P.Y.
- Source
- Full text @ Biomed. Pharmacother.
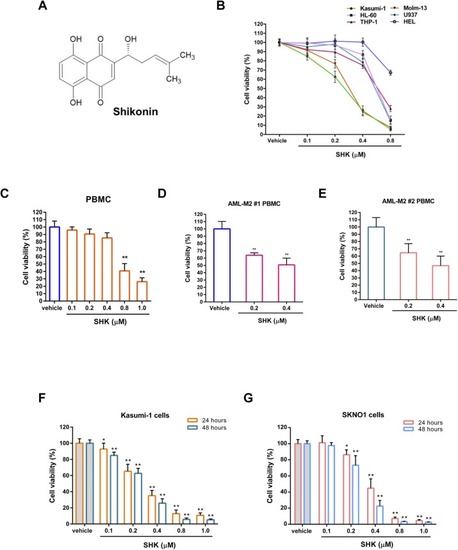
Effects of SHK on the viability of CBF-AML Kasumi-1 cells. (A) The chemical structure of SHK. (B) Kasumi-1, HL-60, THP-1, Molm-13, U-937 and HEL cells were treated with either vehicle (0.1 % DMSO) or SHK (0.1, 0.2, 0.4, and 0.8 μM) for 48 h. The cell viability was analyzed using the MTT assay. (C) PBMC were treated with vehicle or SHK (0.1–1.0 μM) for 48 h. The cell viability was analyzed using the MTT assay. Two AML patient-derived primary PBMCs including (D) AML-M2 #1 PBMC and (E) AML-M2 #2 PBMC were treated with vehicle (0.1 % DMSO) or SHK (0.2 and 0.4 μM) for 48 h. The cell viability was measured by counting cells after trypan blue staining. The CBF-AML cell lines including (F) Kasumi-1 and (G) SKNO-1 cells were treated with vehicle (0.1 % DMSO) or SHK (0.1–1.0 μM) for 24 and 48 h. The cell viability was analyzed using the MTT assay. The data represent the mean ± SD of three independent experiments. The *p < 0.05 and **p < 0.01 indicate significant differences compared to the vehicle-treated cells. |
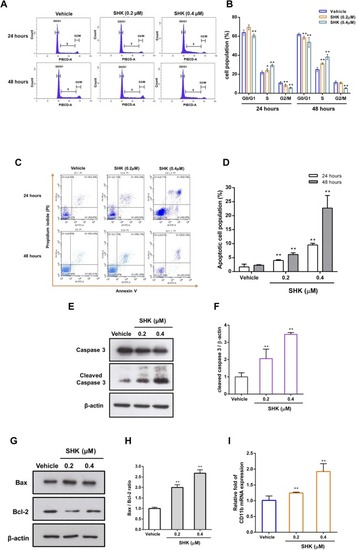
Effects of SHK on cell cycle distribution, cell apoptosis, and differentiation in Kasumi-1 cells. Cells were treated with vehicle or SHK (0.2 and 0.4 μM) for 24 and 48 h, and cell cycle progression was detected by flow cytometric analysis. (A) A representative histogram of cell cycle progression. (B) The cell populations in G0/G1, S, and G2/M phases were quantified. (C) Cell apoptosis was detected by flow cytometric analysis. A representative histogram is shown. (D) The population of apoptotic cells was quantified. (E) and (G) Western blot analysis of caspase 3, cleaved caspase 3, Bax, Bcl2, and β-actin proteins in vehicle- or SHK (0.2 and 0.4 μM)- treated cells. A representative blot is shown. (F) Normalized intensity of cleaved caspase 3 versus β-actin proteins. (H) The ratio of Bax versus Bcl-2 proteins. (I) CD11b mRNA expression was measured by RT-qPCR analysis in Kasumi-1 cells treated with vehicle or SHK for 48 h. Data represent the mean ± SD of three independent experiments. *p < 0.05 and **p < 0.01 represent significant differences compared to the vehicle-treated cells. |
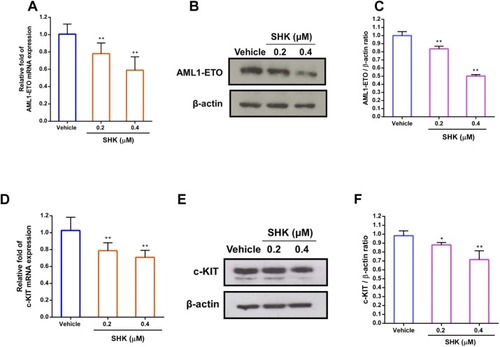
Effects of SHK on AML1-ETO and c-KIT gene expression in Kasumi-1 cells. Kasumi-1 cells were treated with vehicle or SHK (0.2 and 0.4 μM) for 48 h. The mRNA levels of (A) AML1-ETO and (D) c-KIT were determined by RT-qPCR analysis. The protein levels of (B) AML1-ETO and (E) c-KIT were detected by Western blot analysis, and a representative blot is shown. Normalized intensity of (C) AML1-ETO and (F) c-KIT versus β-actin proteins. Data represent the mean ± SD of three independent experiments. *p < 0.05 and **p < 0.01 represent significant differences compared to the vehicle-treated cells. |
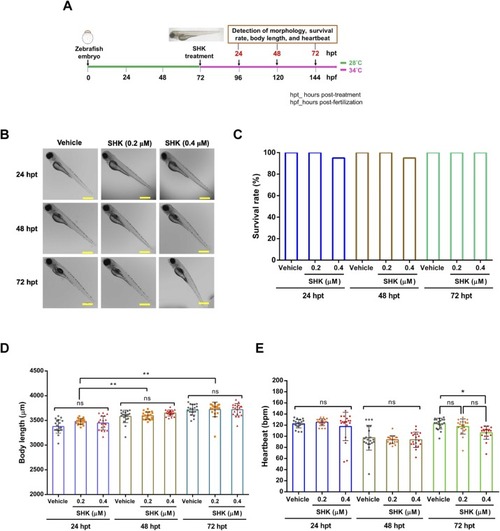
Effects of SHK on toxicity in zebrafish larvae. (A) Schematic illustration depicting the experimental protocol. Zebrafish larvae at 72 hpf were treated with either vehicle (DMSO) or SHK (0.2 and 0.4 μM) in E3 medium and then incubated at 34°C for 24–72 h. Zebrafish larvae were observed after 24, 48, and 72 h of SHK treatment. (B) Morphology was observed using a microscope. Representative images are shown, and the scale bar is 500 μm. (C) Survival percentage, (D) body length, and (E) heartbeat rate was measured as described in the Materials and Methods section. Data are presented as mean ± SD. **p < 0.01 indicates significant differences compared to the 24 hpt group, while "ns" denotes no significant difference. |

Effects of SHK on the growth of leukemia cells in zebrafish xenografts. (A) Schematic illustration depicting the experimental protocol. Kasumi-1 cells labeled with CM-DiI fluorescent dye were injected into the yolk sac of zebrafish larvae at 48 hpf using microinjection techniques, as described in the Materials and Methods section. (B) The xenografts were treated with either vehicle (DMSO) or SHK at concentrations of 0.2 μM for 24–72 h in a 34°C incubator. The fluorescence of Kasumi-1 cells within the larvae was observed under an inverted fluorescence microscope, and representative images were shown. (C) Human-specific GAPDH mRNA and (D) human-specific β-actin mRNA were measured using RT–qPCR analysis. The levels of human-specific GAPDH and β-actin mRNA were normalized to the zebrafish-specific β-actin mRNA in the same sample. Data are presented as mean ± SD. **p < 0.01 indicates significant differences compared to the vehicle-treated groups. |
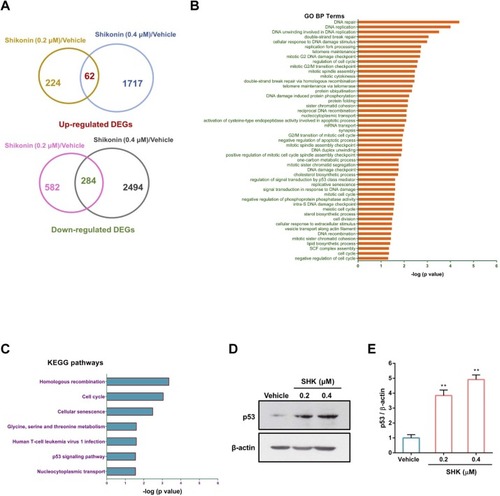
Analysis of DEGs, GO BPs enrichment, and KEGG pathways in SHK-treated Kasumi-1 cells. (A) Kasumi-1 cells were treated with vehicle or SHK (0.2 and 0.4 μM) for 48 h, and the mRNA expression profiles were determined using the human cDNA microarray. The Venn diagram illustrates the co-upregulated and co-downregulated DEGs in response to SHK treatment compared to the vehicle group. (B) Significantly enriched GO BP terms in cells treated with SHK. (C) KEGG pathways enriched by DEGs in SHK-treated cells. (D) Kasumi-1 cells were treated with vehicle or SHK (0.2 and 0.4 μM) for 48 h. The protein levels of p53 and β-actin were determined by Western blot analysis. A representative blot is shown. (E) Normalized intensity of p53 versus β-actin proteins. Data represent the mean ± SD of three independent experiments. **p < 0.01 indicates significant differences compared to the vehicle-treated cells. |
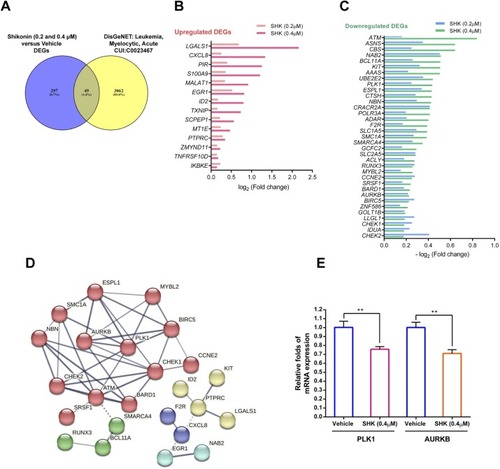
AML-associated genes differentially expressed in SHK-treated Kasumi-1 cells. (A) The Venn diagram illustrates the intersection of the DEGs of SHK-treated cells with the set of AML-associated genes (DisGeNET CUI: C0023467). (B) The 14 upregulated and (C) the 35 down-regulated genes in response to SHK treatment found in the intersection are listed. (D) Predicted PPI network for the AML-associated genes downregulated by SHK was analyzed using the STRING database. (E) Kasumi-1 cells were treated with vehicle or SHK (0.4 μM) for 48 h. The mRNA levels of PLK1 and AURKB were determined by RT-qPCR analysis. Data represent the mean ± SD of three independent experiments. **p < 0.01 indicates significant differences compared to the vehicle-treated cells. |
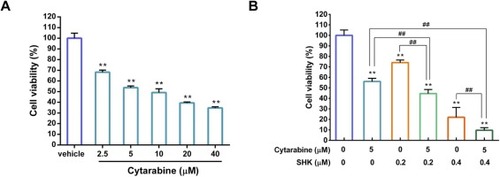
Effects of combined cytarabine and SHK treatment on Kasumi-1 cells. (A) Cells were treated with vehicle or cytarabine (2.5–40 μM) for 48 h, and cell viability was determined by MTT assay. (B) Kasumi-1 cells were co-treated with cytarabine (5 μM) and SHK (0.2 or 0.4 μM) for 48 h, and cell viability was determined by MTT assay. Data represent the mean ± SD of three independent experiments. **p < 0.01 indicates significant differences compared to the vehicle alone-treated group. ##p < 0.01 indicates significant differences compared to the cytarabine alone- or SHK alone-treated group. |
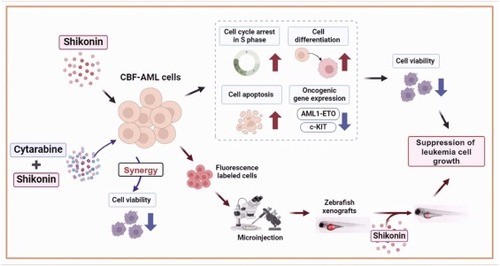
Hypothetic mechanisms of SHK on the suppression of cell growth in vitro in CBF-AML cells and in vivo in zebrafish xenografts. SHK has been found to suppress the growth of CBF-AML Kasumi-1 cells by reducing cell viability, inducing cell cycle arrest, promoting cell apoptosis and differentiation, and downregulating AML1-ETO and c-KIT expression. In zebrafish xenografts, the SHK has been shown to markedly suppress the cell growth of CBF-AML Kasumi-1 cells in zebrafish xenograft models. Additionally, the combination of SHK with cytarabine has demonstrated a synergistic effect on decreasing cell viability in CBF-AML cells. (Created with BioRender.com). |