- Title
-
Cohesin composition and dosage independently affect early development in zebrafish
- Authors
- Labudina, A.A., Meier, M., Gimenez, G., Tatarakis, D., Ketharnathan, S., Mackie, B., Schilling, T.F., Antony, J., Horsfield, J.A.
- Source
- Full text @ Development
|
Combined loss of zebrafish Stag1b and Stag2b phenocopies the null cohesin mutation rad21. (A-C) Lateral views of representative wild-type (A), stag1b−/−; stag2b−/− (B) and rad21−/− (C) embryos at 48 h post-fertilization (hpf). Arrowheads indicate developmental anomalies: magenta for a small head, yellow for pericardial edema, and cyan for a kinked tail. (D-F) Expression of runx1 at 12 somites in wild-type (D), stag1b−/−; stag2b−/− (E) and rad21−/− (F) embryos. Lateral and posterior views are shown. White arrowheads indicate the loss of runx1 expression in PLM. The numbers in the lower left-hand corners of A-F indicate the number of embryos with similar expression patterns. (G-J) Confocal images of cell cycle progression in wild-type (G,I) and stag1b−/−; stag2b−/− (H,J) embryos at 48 hpf stained with anti-α-tubulin (cyan; main panel and left-hand insets), anti-phH3 (yellow; main panel and middle insets) antibodies and Hoechst (magenta; main panel and right-hand insets). Images are maximum intensity projections of three (0.15 μm) optical sections taken from the tail region of 48 hpf embryos. Scale bars: 500 μm (A-F); 5 μm (G-J). |
|
The cell cycle is not blocked in cohesin mutants at the 16-somite stage. (A-F) Confocal images showing S phase and M phase in wild-type (A,D), stag2b−/− (B,E) and rad21−/− (C,F) tailbuds at ∼16 hpf. S phases are detected with anti-BrdU (yellow) and M phases with anti-phH3 (blue) antibodies; nuclei are stained with Hoechst (red). BrdU incorporation was measured after incubation for 30 min (A-C) or 2 h (D-F). Insets show high-magnification images of the boxed areas. Images are maximum intensity projections of 33 (4.8 μm) optical sections. The numbers in the lower left-hand corners indicate the number of embryos with similar staining patterns. Scale bars: 40 μm. (G) Density plot (y-axis) showing the average signal of three replicates per genotype over fluorescence signal (DNA stain DRAQ5, x-axis; au, artificial units). |
|
Bulk RNA-seq analyses of Rad21- and Stag2b-deficient tailbuds. (A) Schematic of progenitor cells and specialized tissues in the zebrafish tailbud. The zebrafish tailbud consists of two pools of bipotent progenitors: neuromesodermal progenitors (NMPs) and midline progenitor cells (MPCs). The dashed line shows the location of tailbud excision for RNA-seq. (B) Principal component analysis of gene expression in wild-type and cohesin-deficient tailbuds at the 16-somite stage. Genotypes are distinguished by color: wild-type samples are displayed in purple, rad21−/− in blue, rad21+/− in green, and stag2b−/− in yellow. (C-E) MA [M (log ratio) and A (mean average) scales] plots displaying changes in gene expression in rad21−/− (C), rad21+/− (D) and stag2b−/− (E) compared with wild-type tailbuds. Each dot represents a gene, with colored dots indicating those with significant (5% FDR) changes in expression; 7520 genes were dysregulated in rad21−/− tailbuds (3678 up- and 3842 downregulated), and 5144 genes were dysregulated in rad21+/− tailbuds (2645 up- and 2499 downregulated). In contrast, stag2b−/− tailbuds had substantially fewer dysregulated genes (2054: 866 up- and 1188 downregulated). |
|
Expression of genes that mark progenitor cells and their derivatives in rad21 and stag2b homozygous mutant tailbuds. (A-D) Bar graphs displaying log2 fold changes of significantly (5% FDR) dysregulated marker genes in rad21−/− (A,C) and stag2b−/− (B,D) tailbuds compared with wild type. The different categories of marker genes are represented by different colors as specified in the key. |
|
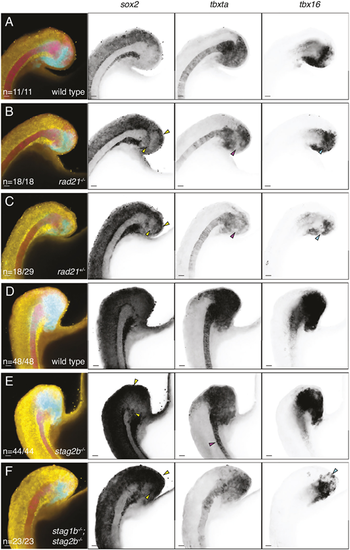
Distribution of sox2, tbxta and tbx16 transcripts in cohesin-deficient tailbuds. (A-F) Wild-type (A,D), rad21−/− (B), rad21+/− (C), stag2b−/− (E) and stag1b−/−; stag2b−/− (F) zebrafish tailbuds at the 16-somite stage showing expression of sox2 (yellow), tbxta (magenta) and tbx16 (cyan). Increased sox2 expression in the NMP region and ectopic expression of sox2 in the mesoderm is indicated by yellow arrowheads (B,C,E,F). Pink arrowheads point to the loss of tbxta expression in the region of mesodermal induction (B,C) and the narrow notochord (E), and cyan arrowheads indicate a decrease in tbx16 expression (B,C,F). Images are maximum intensity projections of three (4.8 μm) optical sections. The number of embryos with each expression pattern out of the total analyzed is noted at the bottom left of the merged panels. Scale bars: 20 μm. |
|
Narrower notochords in stag2b mutants are rescued by additional stag1b mutation. (A,B) Examples of notochord width measurement using tbxta expression (magenta) and absence of sox2 expression (yellow) represented by tailbud images also shown in Fig. 5D,E. Scale bars: 20 μm. (C) Violin plots with overlaid box plots visualizing measurements of notochord width. The box plot limits indicate the interquartile range (IQR) between the first quartile (Q1) and the third quartile (Q3), the horizontal line inside the box represents the median (second quartile, Q2), and the whiskers extend to the smallest and largest values within 1.5× the IQR from Q1 and Q3, respectively, with any points outside this range considered outliers. The genotype and the number of embryos measured in each group are indicated on the x-axis. Significance was determined using an unpaired t-test: *P<0.05, ****P<0.0001. ns, not significant. |
|
Single-cell RNA-seq of tailbuds from embryos at the 16-somite stage shows disruption of Wnt signaling in stag2b−/− NMPs. (A) UMAP dimensional reduction of two integrated datasets of wild-type (15,298 cells) and stag2b−/− (21,278 cells) tailbud samples (total 36,576 cells) with clustering of the major cell types. (B) Stacked bar graph showing cell type proportions in wild type and stag2b−/−, color-coded according to the key in A. (C) Gene set enrichments for genes ranked by Z score for differential expression between wild-type and stag2b−/− NMP clusters. (D) Violin plot of Wnt gene expression signature (log-normalized) among different cell types in stag2b−/− (yellow) and wild-type (purple) embryos. Horizontal dashed lines represent 25th, 50th and 75th percentile. Wilcoxon rank-sum test with 5% FDR. *P<0.05. (E) Dot plot showing the mean expression of DEGs part of FGF, Wnt and BMP pathways in the NMP cluster in wild-type and stag2b−/− embryos. (F) Dot plot of DEGs in the notochord cluster. |
|
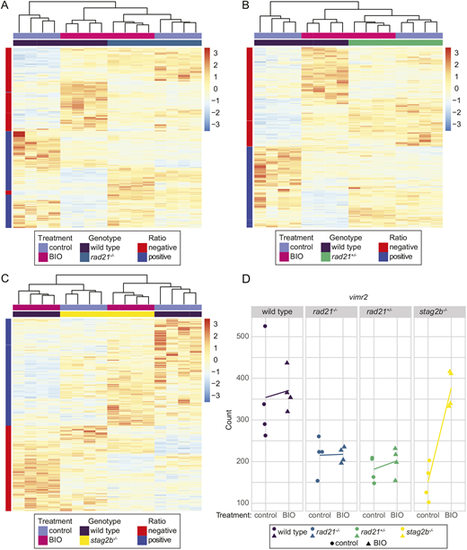
Wnt stimulation normalizes gene expression in stag2b−/− but not in rad21−/− or rad21+/− tailbuds. (A-C) Embryos were treated from shield stage with 2.5 μM BIO, then tailbuds were collected at 16 somites. Four replicate pools of 80 tailbuds were used per condition for RNA-seq. The heatmaps display expression levels of the genes that responded differently to BIO stimulation in cohesin mutant genotypes compared with wild type as determined by an interaction analysis. Heatmaps display results from four replicates of rad21−/− (A), rad21+/− (B) and stag2b−/− (C) versus wild type. Red and blue indicate upregulation and downregulation, respectively, compared with the mean expression. (D) vimr2 expression is rescued by BIO stimulation in stag2b−/− but not in rad21−/− or rad21+/−. Graphs illustrate the transcript counts of vimr2 in wild type (purple), rad21−/− (blue), rad21+/− (green) and stag2b−/− (yellow). The x-axis indicates the treatment status, and the y-axis represents the normalized counts. Lines connect the means of the counts for each sample group. |
|
stag2b mutation affects vimr2 expression in NMPs. (A) Expression of vimr2 in UMAP representation in wild-type and stag2b−/− tailbuds at 16 somites. (B) Violin plot showing downregulation of vimr2 expression in the NMPs in stag2b−/−. Horizontal dashed line represents the median expression value. *P<0.005, Wilcoxon rank-sum test. |
|
Wnt stimulation rescues notochord width in stag2b−/−. (A-D) Expression pattern of tbxta in wild-type (A,C) and stag2b−/− (B,D) zebrafish tailbuds with (C,D) and without (A,B) Wnt stimulation (BIO). Images are maximum intensity projections of three (4.8 μm) optical sections. Scale bars: 20 μm. The number of embryos with each expression pattern out of the total analyzed is noted. (E) Violin plots with overlaid box plots visualizing measurements of notochord width. The box plot limits indicate the interquartile range (IQR) between the first quartile (Q1) and the third quartile (Q3), the horizontal line inside the box represents the median (second quartile, Q2), and the whiskers extend to the smallest and largest values within 1.5× the IQR from Q1 and Q3, respectively, with any points outside this range considered outliers. The x-axis indicates the genotype, treatment status and the number of embryos measured in each group. Significance was determined using an unpaired t-test: **P<0.01, ****P<0.0001. ns, not significant. |


