
Fig. 2
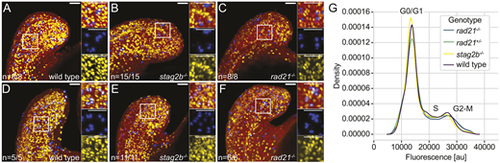
The cell cycle is not blocked in cohesin mutants at the 16-somite stage. (A-F) Confocal images showing S phase and M phase in wild-type (A,D), stag2b−/− (B,E) and rad21−/− (C,F) tailbuds at ∼16 hpf. S phases are detected with anti-BrdU (yellow) and M phases with anti-phH3 (blue) antibodies; nuclei are stained with Hoechst (red). BrdU incorporation was measured after incubation for 30 min (A-C) or 2 h (D-F). Insets show high-magnification images of the boxed areas. Images are maximum intensity projections of 33 (4.8 μm) optical sections. The numbers in the lower left-hand corners indicate the number of embryos with similar staining patterns. Scale bars: 40 μm. (G) Density plot (y-axis) showing the average signal of three replicates per genotype over fluorescence signal (DNA stain DRAQ5, x-axis; au, artificial units). |