Fig. 5
|
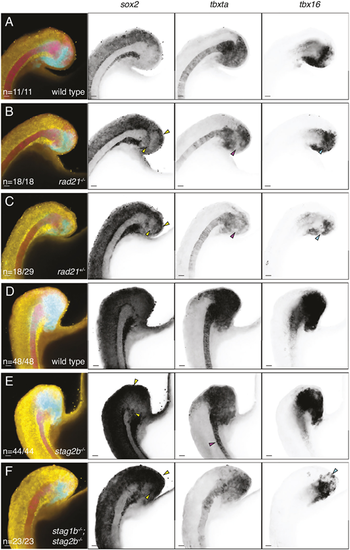
Distribution of sox2, tbxta and tbx16 transcripts in cohesin-deficient tailbuds. (A-F) Wild-type (A,D), rad21−/− (B), rad21+/− (C), stag2b−/− (E) and stag1b−/−; stag2b−/− (F) zebrafish tailbuds at the 16-somite stage showing expression of sox2 (yellow), tbxta (magenta) and tbx16 (cyan). Increased sox2 expression in the NMP region and ectopic expression of sox2 in the mesoderm is indicated by yellow arrowheads (B,C,E,F). Pink arrowheads point to the loss of tbxta expression in the region of mesodermal induction (B,C) and the narrow notochord (E), and cyan arrowheads indicate a decrease in tbx16 expression (B,C,F). Images are maximum intensity projections of three (4.8 μm) optical sections. The number of embryos with each expression pattern out of the total analyzed is noted at the bottom left of the merged panels. Scale bars: 20 μm. |

