
Fig. 8
- ID
- ZDB-IMAGE-240802-37
- Publication
- Labudina et al., 2024 - Cohesin composition and dosage independently affect early development in zebrafish
- All Figures
- Figures for Labudina et al., 2024
|
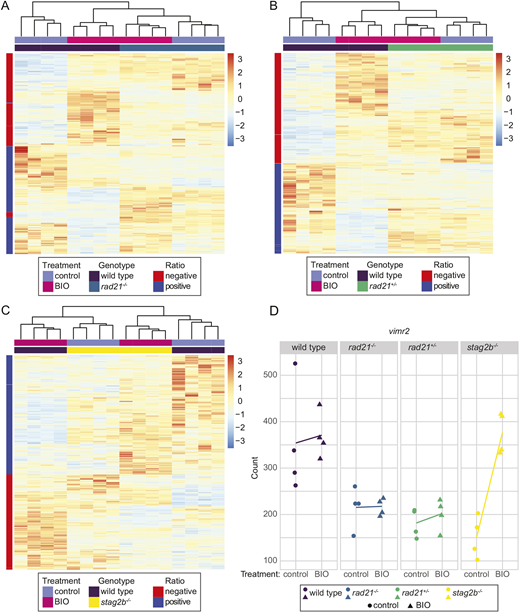
Fig. 8 Wnt stimulation normalizes gene expression in stag2b−/− but not in rad21−/− or rad21+/− tailbuds. (A-C) Embryos were treated from shield stage with 2.5 μM BIO, then tailbuds were collected at 16 somites. Four replicate pools of 80 tailbuds were used per condition for RNA-seq. The heatmaps display expression levels of the genes that responded differently to BIO stimulation in cohesin mutant genotypes compared with wild type as determined by an interaction analysis. Heatmaps display results from four replicates of rad21−/− (A), rad21+/− (B) and stag2b−/− (C) versus wild type. Red and blue indicate upregulation and downregulation, respectively, compared with the mean expression. (D) vimr2 expression is rescued by BIO stimulation in stag2b−/− but not in rad21−/− or rad21+/−. Graphs illustrate the transcript counts of vimr2 in wild type (purple), rad21−/− (blue), rad21+/− (green) and stag2b−/− (yellow). The x-axis indicates the treatment status, and the y-axis represents the normalized counts. Lines connect the means of the counts for each sample group.