
IMAGE
Fig. 4
- ID
- ZDB-IMAGE-240802-33
- Publication
- Labudina et al., 2024 - Cohesin composition and dosage independently affect early development in zebrafish
- All Figures
- Figures for Labudina et al., 2024
Image
|
Figure Caption
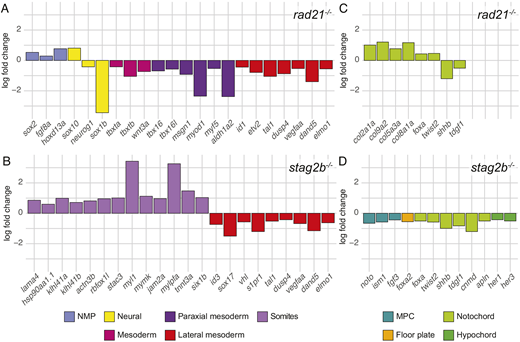
Fig. 4 Expression of genes that mark progenitor cells and their derivatives in rad21 and stag2b homozygous mutant tailbuds. (A-D) Bar graphs displaying log2 fold changes of significantly (5% FDR) dysregulated marker genes in rad21−/− (A,C) and stag2b−/− (B,D) tailbuds compared with wild type. The different categories of marker genes are represented by different colors as specified in the key.
Acknowledgments
This image is the copyrighted work of the attributed author or publisher, and
ZFIN has permission only to display this image to its users.
Additional permissions should be obtained from the applicable author or publisher of the image.
Full text @ Development