
- Title
-
Hepatocyte vitamin D receptor functions as a nutrient sensor that regulates energy storage and tissue growth in zebrafish
- Authors
- Freeburg, S.H., Shwartz, A., Kemény, L.V., Smith, C.J., Weeks, O., Miller, B.M., PenkoffLidbeck, N., Fisher, D.E., Evason, K.J., Goessling, W.
- Source
- Full text @ Cell Rep.
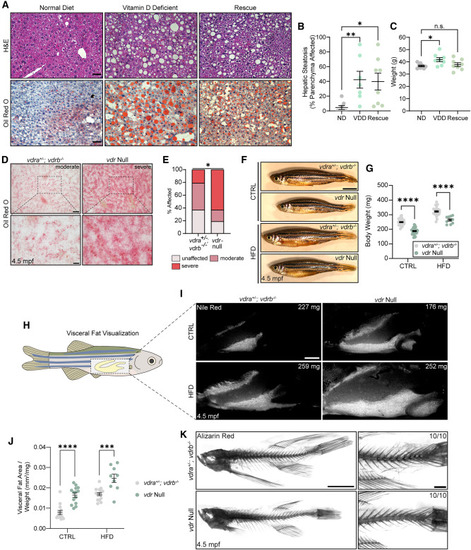
Global depletion of Vdr signaling elicits hepatic steatosis and increases visceral adiposity (A) H&E and oil red O analysis of hepatic steatosis in 11-month-old male mice a fed normal (ND), vitamin D-deficient (VDD), or rescue diet. Scale bars, 50 μm. (B) Quantification of steatosis in H&E-stained liver. Kruskal-Wallis test with Dunn’s multiple comparison test. n = 8 ND, 7 VDD, 8 rescue. (C) Mouse weight. One-way ANOVA with Dunnett’s multiple comparison test. n = 8 per group. (D) Oil red O analysis of hepatic steatosis in male zebrafish liver at 4.5 mpf. Scale bars, 50 μm (top) and 15 μm (bottom). (E) Analysis of oil red O staining severity. Chi-square test. n = 19 vdra+/−; vdrb−/−, 16 vdr null. (F) Images of 4.5-mpf male fish following CTRL or HFD feeding. (G) Fish weight. Two-way ANOVA with Sidak’s multiple comparison test. n = 34 Het.CTRL, 31 Null.CTRL, 28 Het.HFD, 10 Null.HFD. (H) Schematic of visceral fat (yellow, inside the dashed box) anatomy in adult zebrafish. (I) Nile red analysis of visceral fat at 4.5 mpf. Fish weight is noted in each image. Scale bar, 1 mm. (J) Visceral fat area normalized to fish weight. Two-way ANOVA with Sidak’s multiple comparison test. n = 14 Het.CTRL, 14 Null.CTRL, 15 Het.HFD, 9 Null.HFD. (K) Alizarin red analysis of skeletal integrity of CTRL diet-fed fish. The number of individuals resembling the representative image is noted in each image. Scale bar, 1 mm Error bars are mean + SEM. ∗p < 0.05, ∗∗p < 0.01, ∗∗∗p < 0.001, ∗∗∗∗p < 0.0001; n.s., not significant. See also Figure S1 . PHENOTYPE:
|
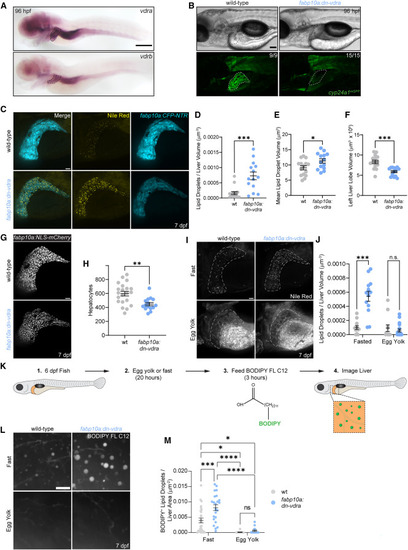
Hepatocyte Vdr impairment stimulates fatty acid storage and diminishes liver growth (A) In situ hybridization for vdra and vdrb in 96-hpf larvae. A dashed line marks the liver. Scale bar, 200 μm. (B) Representative images of cyp24a1mGFP expression at 96 hpf. Dashed lines mark the liver. Scale bar, 100 μm. The number of fish resembling representative images is noted. (C) Analysis of hepatic steatosis and liver size in fabp10a:CFP-NTR larvae following Nile red staining at 7 dpf. Scale bar, 30 μm. (D) Liver lipid droplets per liver volume. Two-tailed Mann-Whitney test. (E) Mean lipid droplet volume. Unpaired two-tailed t test. (F) Left liver lobe volume. Two-tailed Mann-Whitney test. (D–F) n = 15 wild-type (WT), 14 dn-vdra. (G) Hepatocyte quantification in fabp10a:NLS-mCherry larvae at 7 dpf. Scale bar, 30 μm. (H) Left liver lobe hepatocytes. Unpaired two-tailed t test. n = 21 WT, 15 dn-vdra. (I) Analysis of liver lipid content following fasting or 20-h feeding of 0.25% egg yolk and Nile red staining at 7 dpf. The liver is outlined. Scale bar, 30 μm. (J) Liver lipid droplets per liver volume. Two-way ANOVA with Sidak’s multiple comparison test. n = 12 WT.Fast, 12 WT.Yolk, 13 dn-vdra.Fast, 18 dn-vdra.Yolk. (K) Schematic of the BODIPY FL C12 metabolic tracing approach. (L) Maximum intensity projection of livers after 20-h incubation in 0.25% egg yolk solution or fasting followed by feeding of BODIPY FL C12. Scale bar, 10 μm (M) BODIPY+ lipid droplets per liver area. Two-way ANOVA with Tukey’s multiple comparison test. n = 27 WT.Fast, 23 dn-vdra.Fast, 13 WT.Egg, 14 dn-vdra.Egg. Error bars are mean + SEM. ∗p < 0.05, ∗∗p < 0.01, ∗∗∗p < 0.001, ∗∗∗∗p < 0.0001. See also Figure S3 . |
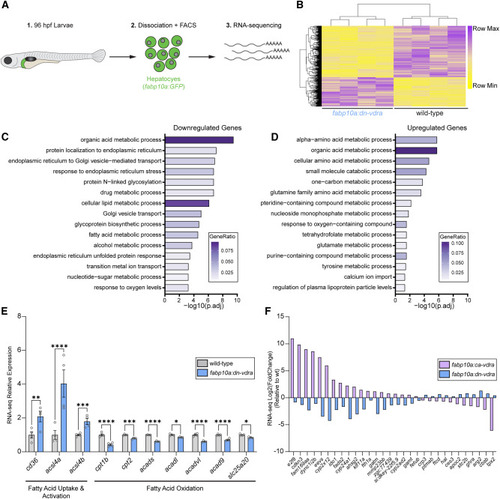
Hepatocyte VDR transcriptionally promotes lipid storage over fatty acid oxidation (A) Schematic of the RNA sequencing approach for fabp10a:GFP hepatocytes collected at 96 hpf. (B) Heatmap of normalized counts of differentially expressed genes in 96-hpf fabp10a:dn-vdra hepatocytes compared to the WT. Wald test with false discovery rate correction (adjusted p value [padj] < 0.05). Each sample represents hepatocytes from approximately 35 larvae. n = 4 per group. (C and D) ClusterProfiler overrepresentation analysis of downregulated (C) and upregulated (D) genes identified by RNA sequencing. GeneRatio is the fraction of differentially expressed genes that belong to a given gene set divided by the total number of genes belonging to that gene set. (E) RNA sequencing relative expression values for genes involved in fatty acid uptake/activation and oxidation that are altered in fabp10a:dn-vdra hepatocytes. Wald test with false discovery rate correction. Adjusted p values are indicated. n = 4 per group. Error bars are mean + SEM. (F) Plot of RNA sequencing log2(FoldChange) for genes that are differentially expressed in opposite directions in fabp10a:dn-vdra and fabp10a:ca-vdra hepatocytes relative to the WT (padj < 0.05). Error bars are mean + SEM. ∗p < 0.05, ∗∗p < 0.01, ∗∗∗p < 0.001, ∗∗∗∗p < 0.0001. See also Figure S3 . |
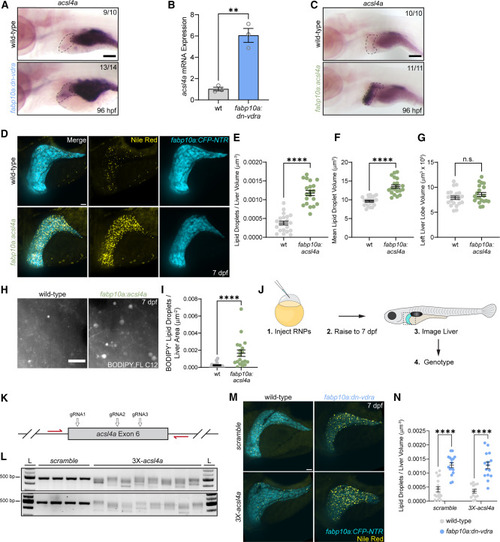
acsl4a overexpression is induced by Vdr impairment and causes hepatic steatosis (A) In situ hybridization for acsl4a at 96 hpf. Liver is indicated with a dashed line. The number of individuals resembling the representative image is noted in each image. Scale bar, 100 μm. (B) RT-qPCR analysis of acsl4a expression from FACS-purified hepatocytes collected at 7 dpf. Each sample represents hepatocytes from approximately 35 larvae. Unpaired two-tailed t test. n = 3 per group. (C) In situ hybridization for at 96 hpf. The liver is indicated with a dashed line. The number of individuals resembling the representative image is noted in each image. Scale bar, 100 μm. (D) Analysis of hepatic steatosis and liver size in fabp10a:CFP-NTR larvae following Nile red staining at 7 dpf. Scale bar, 30 μm. (E) Liver lipid droplets per liver volume. (F) Mean lipid droplet volume. (G) Left liver lobe volume. (E–G) Unpaired two-tailed t test. n = 21 WT, 20 dn-vdra. (H) Maximum intensity projections illustrating hepatic fatty acid storage following 3-h BODIPY FL C12 pulse. Scale bar, 10 μm. (I) BODIPY FL C12+ lipid droplets per liver area. Two-tailed Mann-Whitney test. n = 15 WT, 19 acsl4a. (J) Schematic of the F0 CRISPR mutagenesis experiment to assess the necessity of acsl4a in dn-vdra-induced steatosis. (K) Schematic of acsl4a exon 6 targeted with 3 CRISPR guide RNAs and flanked by PCR primers (red arrows). (L) Representative gels of acsl4a exon 6 PCR products following injection of RNPs containing a non-targeting scramble CTRL guide or 3 pooled gRNAs targeting acsl4a. L, ladder. (M) Analysis of hepatic steatosis in fabp10a:CFP-NTR larvae injected with CTRL or acsl4a-targeting RNPs and stained with Nile red at 7 dpf. Scale bar, 30 μm (N) Liver lipid droplets per liver volume. Two-way ANOVA with Sidak’s multiple comparison test. n = 17 WT.scramble, 13 WT.acsl4a, 16 dn-vdra.scramble, 15 dn-vdra.acsl4a. Error bars are mean + SEM. ∗∗p < 0.01, ∗∗∗p < 0.001. See also Figure S4 . |
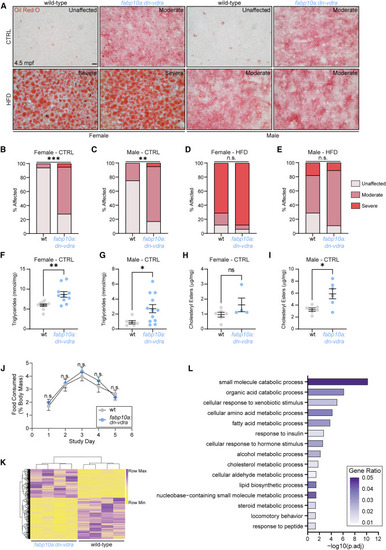
Loss of hepatocyte Vdr signaling elicits hepatic steatosis in adult zebrafish (A) Oil red O analysis of hepatic steatosis at 4.5 mpf following 8 weeks of CTRL or HFD. Staining severity used for analysis in (B–E) is noted in each image. Scale bar, 10 μm. (B–E) Analysis of oil red O staining severity. Chi-square test. n = 18 WT.CTRL.female, 18 dn-vdra.CTRL.female, 16 WT.CTRL.male, 18 dn-vdra.CTRL.male, 17 WT.HFD.female, 16 dn-vdra.HFD.female, 17 WT.HFD.male, 18 dn-vdra.HFD.male. (F) Triglyceride measurement in CTRL female liver. Each sample represents a single liver. Unpaired two-tailed t test. n = 10 per group. (G) Triglyceride measurement in CTRL male liver. Each sample represents two livers. n = 6 WT, 12 dn-vdra. Unpaired two-tailed t test. (H–I) Cholesteryl ester measurement in CTRL female (H) and male (I) liver. Each sample represents two livers. (H) Unpaired two-tailed t test. n = 6 WT, 4 dn-vdra. (I) Unpaired two-tailed t test. n = 6 per group. (J) Adult food consumption over a 5-day period expressed as a fraction of fish weight. Two-way ANOVA with Sidak’s multiple comparison test. n = 6 males, 6 females per group. (K) Heatmap of differentially expressed genes in fabp10a:dn-vdra adult liver (4.5 mpf). Wald test with false discovery rate adjustment (padj < 0.05). Each sample represents RNA from 3 pooled livers. n = 4 per group. (L) ClusterProfiler overrepresentation analysis of differentially expressed genes identified by RNA sequencing. GeneRatio is the fraction of differentially expressed genes that belong to a given gene set divided by the total number of genes belonging to that gene set. Error bars are mean + SEM. ∗p < 0.05, ∗∗p < 0.01, ∗∗∗p < 0.001. See also Figure S5 and Table S7 . PHENOTYPE:
|
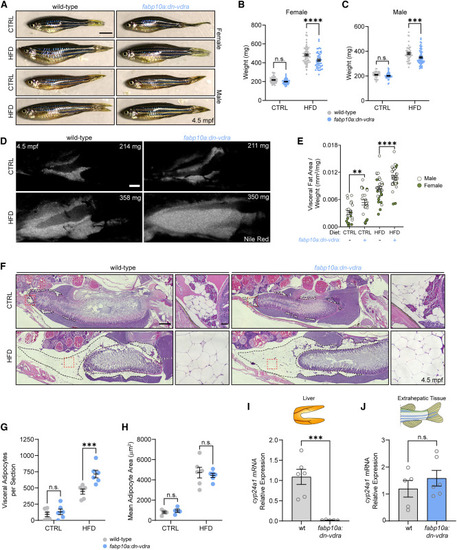
Hepatocyte Vdr impairment reduces organismal growth induced by nutrient repletion and causes visceral fat expansion (A) 4.5-mpf fish following 8 weeks of CTRL or HFD. Scale bar, 0.5 cm. (B) Female weight at 4.5 mpf. Two-way ANOVA with Sidak’s multiple comparison test. n = 58 WT.CTRL, 51 dn-vdra.CTRL, 71 WT.HFD, 50 dn-vdra.HFD. (C) Male weight at 4.5 mpf. Two-way ANOVA with Sidak’s multiple comparison test. n = 36 WT.CTRL, 42 dn-vdra.CTRL, 45 WT.HFD, 66 dn-vdra.HFD. (D) Nile red analysis of visceral fat at 4.5 mpf following CTRL or HFD treatment. Fish weight is specified in each image. Scale bar, 1 mm. (E) Visceral fat area normalized to fish weight. Two-way ANOVA with Sidak’s multiple comparison test. n = 24 WT.CTRL, 23 dn-vdra.CTRL, 34 WT.HFD, 34 dn-vdra.HFD. (F) H&E staining of sagittal sections of females at 4.5 mpf following CTRL or HFD treatment. Visceral adipose tissue is outlined with dashed black lines. Red dashed boxes delineate the magnified region. Scale bars, 500 μm and 50 μm (magnified images). (G) Visceral adipocytes per sagittal section. Two-way ANOVA with Sidak’s multiple comparison test. n = 6 per group. (H) Mean adipocyte area. Two-way ANOVA with Sidak’s multiple comparison test. n = 4 per group for CTRL, 6 per group for HFD. (I and J) RT-qPCR analysis of hepatic (I) and extrahepatic (J) cyp24a1 expression. Unpaired two-tailed t test. Each sample is a single liver or extrahepatic tissue specimen. n = 6 WT, 5 dn-vdra. Error bars are mean + SEM. ∗∗p < 0.01, ∗∗∗p < 0.001, ∗∗∗∗p < 0.0001. See also Figure S6 . |
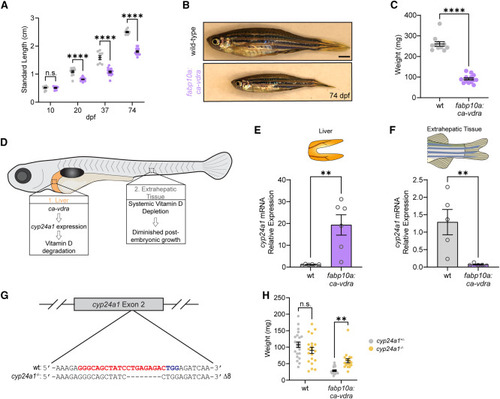
Hepatic Vdr hyperactivation constrains organismal growth by diminishing global vitamin D signaling (A) Time course of fish length from 10–74 dpf. Two-way ANOVA with Sidak’s multiple comparison test. Sex was not considered because ca-vdra growth stunting precludes sex identification. n = 16 WT.10dpf, 9 ca-vdra.10dpf, 12 WT.20dpf, 20 ca-vdra.20dpf, 9 WT.37dpf, 15 ca-vdra.37dpf, 11 WT.74dpf, 13 ca-vdra.74dpf. Samples from different time points are independent individuals. (B) Representative images of fish at 74 dpf. Scale bar, 1 mm. (C) Fish weight at 74 dpf. Unpaired two-tailed t test. n = 11 WT, 13 ca-vdra. (D) Schematic of the proposed effects of hepatic ca-vdra expression on global vitamin D signaling and growth. Hepatic Vdr hyperactivation induces cyp24a1 expression, which depletes hepatic and thereby systemic vitamin D signaling, resulting in diminished growth. (E) RT-qPCR analysis of hepatic cyp24a1 expression. Unpaired two-tailed t test. Each sample is a single liver. n = 6 per group. (F) RT-qPCR analysis of cyp24a1 expression in extrahepatic tissue. Two-tailed Mann-Whitney test. Each sample is derived from a single fish. n = 5 per group. (G) Sequence alignment illustrating 8-bp deletion induced by CRISPR targeting of the cyp24a1 locus. Red, guide RNA (gRNA) sequence. Blue, protospacer adjacent motif sequence. (H) Effect of cyp24a1 mutation on fish weight at 1.5 mpf. Two-way ANOVA with Sidak’s multiple comparison test. n = 22 WT.HET, 20 WT.MUT, 22 ca-vdra.HET, 18 ca-vdra.MUT. Error bars are mean + SEM. ∗∗p < 0.01, ∗∗∗∗p < 0.0001. EXPRESSION / LABELING:
PHENOTYPE:
|