
Fig. 7
- ID
- ZDB-IMAGE-240731-65
- Genes
- Publication
- Freeburg et al., 2024 - Hepatocyte vitamin D receptor functions as a nutrient sensor that regulates energy storage and tissue growth in zebrafish
- All Figures
- Figures for Freeburg et al., 2024
|
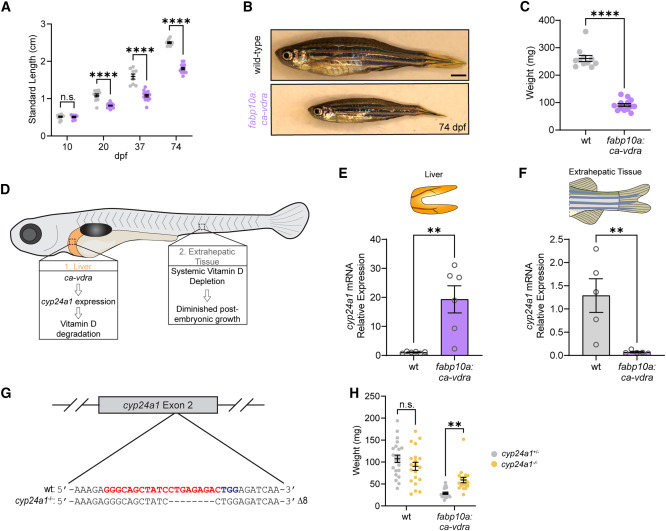
Fig. 7 Hepatic Vdr hyperactivation constrains organismal growth by diminishing global vitamin D signaling (A) Time course of fish length from 10–74 dpf. Two-way ANOVA with Sidak’s multiple comparison test. Sex was not considered because ca-vdra growth stunting precludes sex identification. n = 16 WT.10dpf, 9 ca-vdra.10dpf, 12 WT.20dpf, 20 ca-vdra.20dpf, 9 WT.37dpf, 15 ca-vdra.37dpf, 11 WT.74dpf, 13 ca-vdra.74dpf. Samples from different time points are independent individuals. (B) Representative images of fish at 74 dpf. Scale bar, 1 mm. (C) Fish weight at 74 dpf. Unpaired two-tailed t test. n = 11 WT, 13 ca-vdra. (D) Schematic of the proposed effects of hepatic ca-vdra expression on global vitamin D signaling and growth. Hepatic Vdr hyperactivation induces cyp24a1 expression, which depletes hepatic and thereby systemic vitamin D signaling, resulting in diminished growth. (E) RT-qPCR analysis of hepatic cyp24a1 expression. Unpaired two-tailed t test. Each sample is a single liver. n = 6 per group. (F) RT-qPCR analysis of cyp24a1 expression in extrahepatic tissue. Two-tailed Mann-Whitney test. Each sample is derived from a single fish. n = 5 per group. (G) Sequence alignment illustrating 8-bp deletion induced by CRISPR targeting of the cyp24a1 locus. Red, guide RNA (gRNA) sequence. Blue, protospacer adjacent motif sequence. (H) Effect of cyp24a1 mutation on fish weight at 1.5 mpf. Two-way ANOVA with Sidak’s multiple comparison test. n = 22 WT.HET, 20 WT.MUT, 22 ca-vdra.HET, 18 ca-vdra.MUT. Error bars are mean + SEM. ∗∗p < 0.01, ∗∗∗∗p < 0.0001.