
Fig. 5
- ID
- ZDB-FIG-240731-63
- Publication
- Freeburg et al., 2024 - Hepatocyte vitamin D receptor functions as a nutrient sensor that regulates energy storage and tissue growth in zebrafish
- Other Figures
- All Figure Page
- Back to All Figure Page
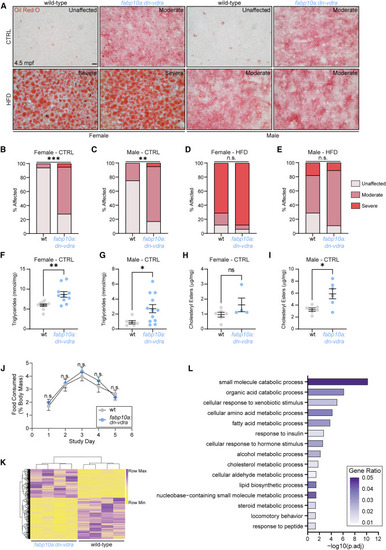
Loss of hepatocyte Vdr signaling elicits hepatic steatosis in adult zebrafish (A) Oil red O analysis of hepatic steatosis at 4.5 mpf following 8 weeks of CTRL or HFD. Staining severity used for analysis in (B–E) is noted in each image. Scale bar, 10 μm. (B–E) Analysis of oil red O staining severity. Chi-square test. n = 18 WT.CTRL.female, 18 dn-vdra.CTRL.female, 16 WT.CTRL.male, 18 dn-vdra.CTRL.male, 17 WT.HFD.female, 16 dn-vdra.HFD.female, 17 WT.HFD.male, 18 dn-vdra.HFD.male. (F) Triglyceride measurement in CTRL female liver. Each sample represents a single liver. Unpaired two-tailed t test. n = 10 per group. (G) Triglyceride measurement in CTRL male liver. Each sample represents two livers. n = 6 WT, 12 dn-vdra. Unpaired two-tailed t test. (H–I) Cholesteryl ester measurement in CTRL female (H) and male (I) liver. Each sample represents two livers. (H) Unpaired two-tailed t test. n = 6 WT, 4 dn-vdra. (I) Unpaired two-tailed t test. n = 6 per group. (J) Adult food consumption over a 5-day period expressed as a fraction of fish weight. Two-way ANOVA with Sidak’s multiple comparison test. n = 6 males, 6 females per group. (K) Heatmap of differentially expressed genes in fabp10a:dn-vdra adult liver (4.5 mpf). Wald test with false discovery rate adjustment (padj < 0.05). Each sample represents RNA from 3 pooled livers. n = 4 per group. (L) ClusterProfiler overrepresentation analysis of differentially expressed genes identified by RNA sequencing. GeneRatio is the fraction of differentially expressed genes that belong to a given gene set divided by the total number of genes belonging to that gene set. Error bars are mean + SEM. ∗p < 0.05, ∗∗p < 0.01, ∗∗∗p < 0.001. See also Figure S5 and Table S7 . |