
- Title
-
The RNA binding protein IGF2BP2/IMP2 alters the cargo of cancer cell-derived extracellular vesicles supporting tumor-associated macrophages
- Authors
- Mashayekhi, V., Schomisch, A., Rasheed, S., Aparicio-Puerta, E., Risch, T., Yildiz, D., Koch, M., Both, S., Ludwig, N., Legroux, T.M., Keller, A., M�ller, R., Fuhrmann, G., Hoppst�dter, J., Kiemer, A.K.
- Source
- Full text @ Cell Commun. Signal.
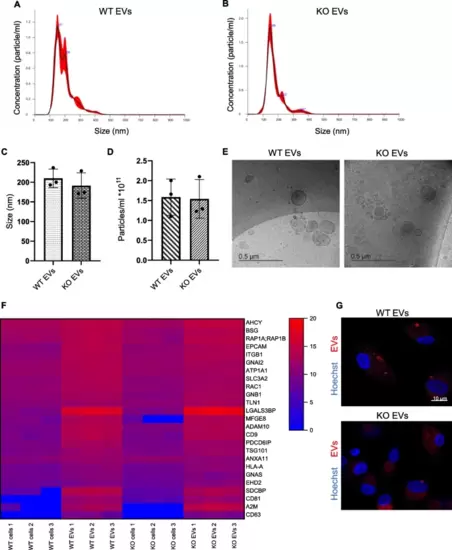
Characterization of HCT116 parental and KO cell-derived EVs isolated via the TFF system. A, B Representative NTA size distribution profiles of isolated EVs. C, D NanoSight quantification of EV preparations' size (C) and concentration (D) are shown as mean � SD, n = 3 individual EV isolation, triplicates). E Cryo-TEM images of EVs, scale bar: 500 nm. F Abundance of 25 vesicle markers in WT and KO cells and EVs. Values are shown as log2 signal intensity of three independent preparations. G Cellular internalization of EVs into primary macrophages (1:10,000 cell:EV). Cells were incubated for 24 h with WT and KO EVs labeled with CFSE. Magnification, 63x, scale bar: 10 �m |
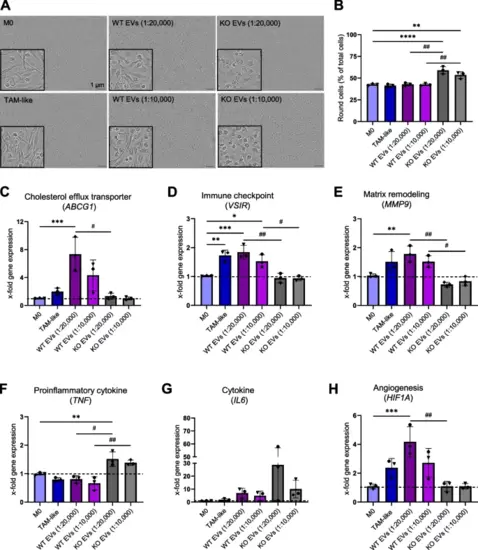
EVs change cell morphology, gene expression levels, surface markers, secretion of cytokines, and MMPs A, B Cells were grouped based on their eccentricity into a round or elongated phenotype by the Incucyte� cell-by-cell analysis software. A Representative images of macrophages, either non-polarized (M0), polarized for 24 h with TCM (TAM-like) or with EVs (1:20,000 and 1:10,000) that were isolated with the TFF system. B Respective quantification of the cell population with round morphology (n = 3 individual donors, triplicates). C-H Gene expression in M0 and macrophages polarized with either EVs or TCM was assessed by qPCR after 24 h incubation (n = 3 individual donors, triplicates). I, J Surface marker expression was quantified in M0 and polarized macrophages by flow cytometry. Primary macrophages were incubated with EVs isolated with the UC method at a ratio of 1:10,000 (cell:EV), and TCM for 24 h. I Representative histograms. J Median fluorescence intensities (MFIs) are shown as x-fold of M0 (n = 3 individual donors, duplicates). K-L Macrophages were polarized for 24 h with TCM and EVs at a ratio of 1:10,000 (cell:EV) that were isolated with the UC method. The secretion of TNF (K) and IL6 (L) was quantified in M0 and EV-polarized macrophages by ELISA (n = 2 individual donors, triplicates). Data are represented as mean � SD, and p < 0.05 is considered significant. * indicates a significant difference between treatments and M0. # shows a significant difference between WT and KO EVs. M Comparison of MMP9 secretion into macrophage supernatant by gelatin zymography assay (n = 2 individual donors). HCT116 cell lysate was used as a positive control |
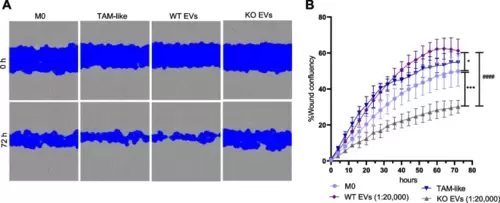
WT EV-polarized macrophage supernatant increases cancer cell migration. Primary macrophages were polarized with EVs isolated with the TFF system at a ratio of 1:20,000 (cell:EV), and TCM (TAM-like) for 24 h. The supernatant from the non-polarized M0 and polarized macrophages was added to the HCT116 cells, and the wound closure was assessed over 72 h with an Incucyte live cell imaging system. A Representative images of cancer cells at times 0 and 72 h after the addition of the supernatants. B Statistical analysis was performed for the last time point using one-way ANOVA followed by Bonferroni's post-hoc test. Data are presented as mean � SD, and p < 0.05 was considered statistically significant (n = 3 individual donors, triplicate). * indicates a significant difference between treatments and M0. # shows a significant difference between WT and KO EVs |
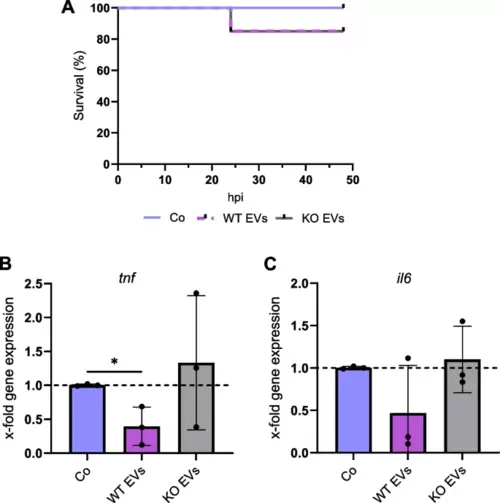
Zebrafish embryo model. mpeg1-eGFP transgenic zebrafish larvae were injected with 7,500 EV/larva and 18 h after injection, eGFP+ macrophages were isolated using FACS. A Kaplan?Meier graph shows the percentage of survival up to 48 h post-injection with EVs isolated with the TFF system. B, C Changes in the expression of tnf and il6 in macrophages were quantified by qPCR, and data were normalized to the housekeeping gene eef1a. Statistical analysis was performed using one-way ANOVA followed by Bonferroni's post-hoc test. * shows a significant difference between Co and EVs. Data are presented as mean � SD, and p < 0.05 was considered statistically significant (n = 3 biological replicates, 100?150 embryos/condition). Co: larvae injected with HEPES buffer, hpi: hours post-injection |
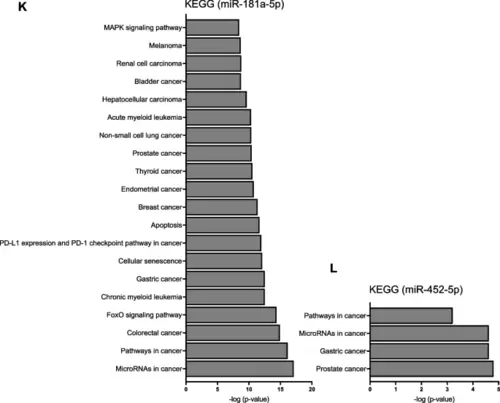
miRNA-Seq data. A, B PCA shows a clear distinction between WT and KO EVs (left) and HCT116 parental and KO cells (right). C, D Differentially expressed miRNAs in EVs (right) and cells (left) are shown as volcano plots. Log2 Fold change is plotted against -log10 p-value (4 biological replicates). E-J The presence of miRNAs was assessed by qPCR in EV and cell samples. The content of miRNAs in EVs (E?G) and cells (H-J) was normalized to 16-5p and U6, respectively, and is shown as fold change relative to WT samples. Statistical analysis was performed using Student's t-test, and data are presented as mean � SD, n = 3, triplicates. # shows a significant difference between WT and KO EVs. K, L KEGG pathway enrichment for miR-181a-5p and miR-452-5p. KEGG pathway enrichment for miR-181a-5p (left) and miR-452-5p (right) are shown. The analysis was performed using miRTargetLink 2.0 |
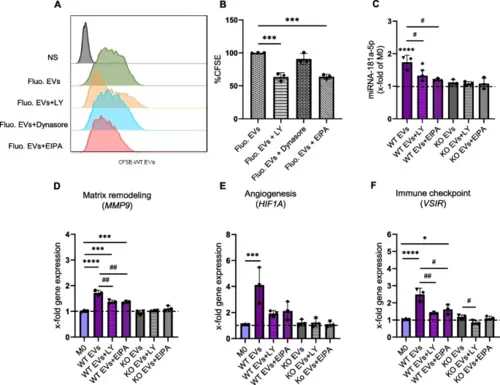
EV uptake is reduced with inhibitors. A, B Measurement of fluorescent EV uptake by flow cytometry. Macrophages were pre-treated with either LY294002 (LY), Dynasore, or EIPA for 1 h, followed by an additional 6 h incubation with CFSE-labeled WT EVs (n = 3 individual donors, one replicate). Representative histogram (A), Relative CFSE fluorescence compared to cells treated with fluorescent EVs but without inhibitor (B). NS: non-stained. C The amount of miR-181a-5p was quantified by qPCR after 1 h pre-treatment with the inhibitors and then 6 h incubation with WT and KO EVs (1:20,000 cell:EV ratio). D-F Changes in the expression of MMP9, HIF1A, and VSIR were assessed in macrophages incubated with EVs in the presence and absence of the inhibitors. Statistical analysis was performed using one-way ANOVA followed by Bonferroni's post-hoc test. Data are presented as mean � SD, n = 3 individual donors, triplicates. * indicates a significant difference between treatments and M0. # shows a significant difference between EVs and EVs with inhibitors |
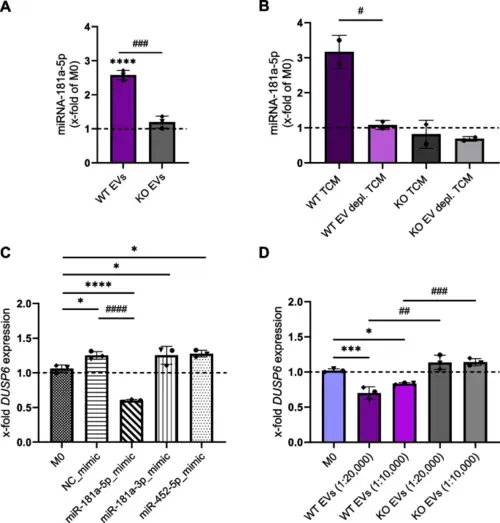
miR-181a-5p negatively regulates the expression of DUSP6 MAPK phosphatase. A Content of miR-181a-5p in EV-treated macrophages. The amount of miR-181a-5p was quantified by qPCR after 24 h incubation with WT and KO EVs (1:20,000; cell:EV ratio). B Content of miR-181a-5p in macrophages polarized with WT and KO TCM and TFF EV-depleted TCM. The amount of miR-181a-5p was quantified by qPCR after 24 h incubation. C Non-polarized M0 were transfected with 100 nM miRNA mimics or NTC for 24 h, and the mRNA levels of DUSP6 were assessed by qPCR. D mRNA levels of DUSP6 in macrophages polarized with EVs. Statistical analysis was performed using one-way ANOVA followed by Bonferroni's post-hoc test. Data are presented as mean � SD, n = 3 individual donors, triplicates. * indicates a significant difference between treatments and M0. # shows a significant difference between WT and KO EVs |
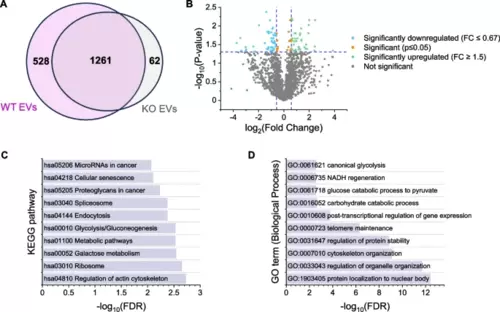
Proteomics data. A Total number of proteins detected in WT and KO EVs (= proteins with valid measurements in 3/3 preparations). B Differentially expressed proteins in KO vs. WT EVs. Log2 Fold Change is plotted against -log10 p-value. Proteins absent in one EV type are not shown. C, D KEGG Pathway (C) and GO term (D) enrichment for differentially abundant proteins |
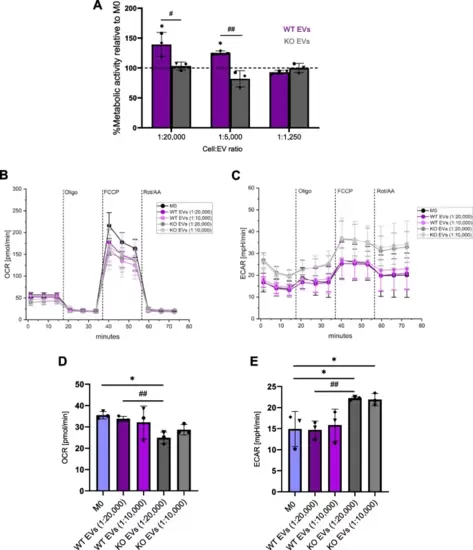
EVs affect macrophage metabolism. A The metabolic activity of primary macrophages was measured using an MTT assay 24 h after polarization with EVs isolated with the TFF system (1:20,000?1:1,250 cell:EV ratios). Data are presented as a percentage of metabolic activity relative to non-polarized M0 (mean � SD, n = 3 individual donors, triplicates). B-E M0 macrophages were polarized with EVs isolated with the TFF system at different cell:EV ratios (1:20,000 and 1:10,000) for 24 h. OCR and ECAR were measured with a mito stress test using a Seahorse� XFe96 Flux Analyzer. B Basal OCR. C ECAR in different macrophage subsets, and D, E Respective quantifications. Statistical analysis was performed using one-way ANOVA followed by Bonferroni's post-hoc test. Data are presented as mean � SD (n = 3 individual donors, quintuplicate). * indicates a significant difference between treatments and M0. # shows a significant difference between WT and KO EVs |