
|
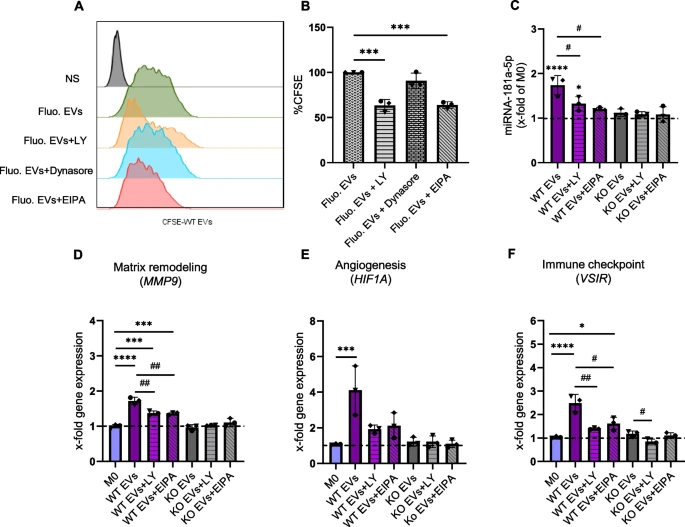
Fig. 6 EV uptake is reduced with inhibitors. A, B Measurement of fluorescent EV uptake by flow cytometry. Macrophages were pre-treated with either LY294002 (LY), Dynasore, or EIPA for 1 h, followed by an additional 6 h incubation with CFSE-labeled WT EVs (n = 3 individual donors, one replicate). Representative histogram (A), Relative CFSE fluorescence compared to cells treated with fluorescent EVs but without inhibitor (B). NS: non-stained. C The amount of miR-181a-5p was quantified by qPCR after 1 h pre-treatment with the inhibitors and then 6 h incubation with WT and KO EVs (1:20,000 cell:EV ratio). D-F Changes in the expression of MMP9, HIF1A, and VSIR were assessed in macrophages incubated with EVs in the presence and absence of the inhibitors. Statistical analysis was performed using one-way ANOVA followed by Bonferroni's post-hoc test. Data are presented as mean ± SD, n = 3 individual donors, triplicates. * indicates a significant difference between treatments and M0. # shows a significant difference between EVs and EVs with inhibitors