
|
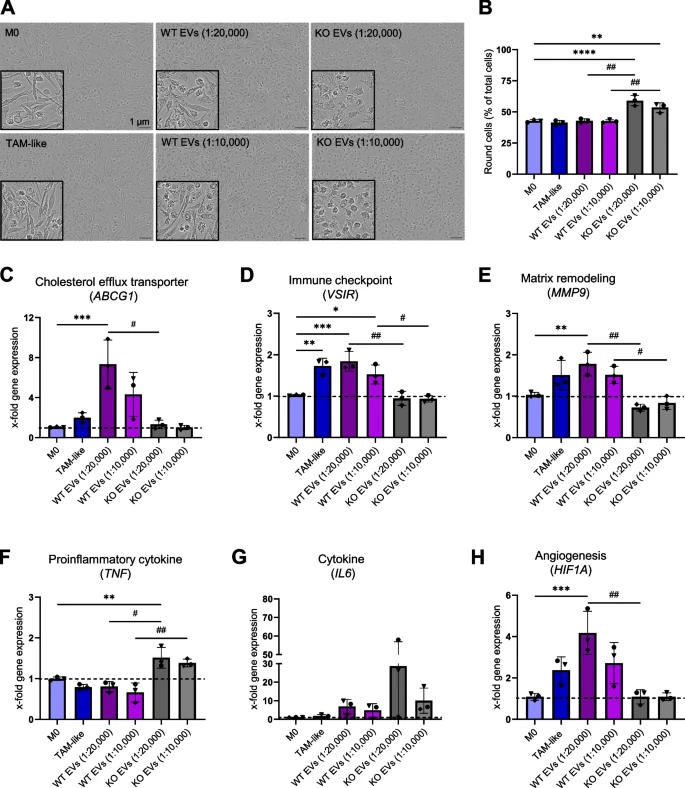
Fig. 2 EVs change cell morphology, gene expression levels, surface markers, secretion of cytokines, and MMPs A, B Cells were grouped based on their eccentricity into a round or elongated phenotype by the Incucyte® cell-by-cell analysis software. A Representative images of macrophages, either non-polarized (M0), polarized for 24 h with TCM (TAM-like) or with EVs (1:20,000 and 1:10,000) that were isolated with the TFF system. B Respective quantification of the cell population with round morphology (n = 3 individual donors, triplicates). C-H Gene expression in M0 and macrophages polarized with either EVs or TCM was assessed by qPCR after 24 h incubation (n = 3 individual donors, triplicates). I, J Surface marker expression was quantified in M0 and polarized macrophages by flow cytometry. Primary macrophages were incubated with EVs isolated with the UC method at a ratio of 1:10,000 (cell:EV), and TCM for 24 h. I Representative histograms. J Median fluorescence intensities (MFIs) are shown as x-fold of M0 (n = 3 individual donors, duplicates). K-L Macrophages were polarized for 24 h with TCM and EVs at a ratio of 1:10,000 (cell:EV) that were isolated with the UC method. The secretion of TNF (K) and IL6 (L) was quantified in M0 and EV-polarized macrophages by ELISA (n = 2 individual donors, triplicates). Data are represented as mean ± SD, and p < 0.05 is considered significant. * indicates a significant difference between treatments and M0. # shows a significant difference between WT and KO EVs. M Comparison of MMP9 secretion into macrophage supernatant by gelatin zymography assay (n = 2 individual donors). HCT116 cell lysate was used as a positive control