
|
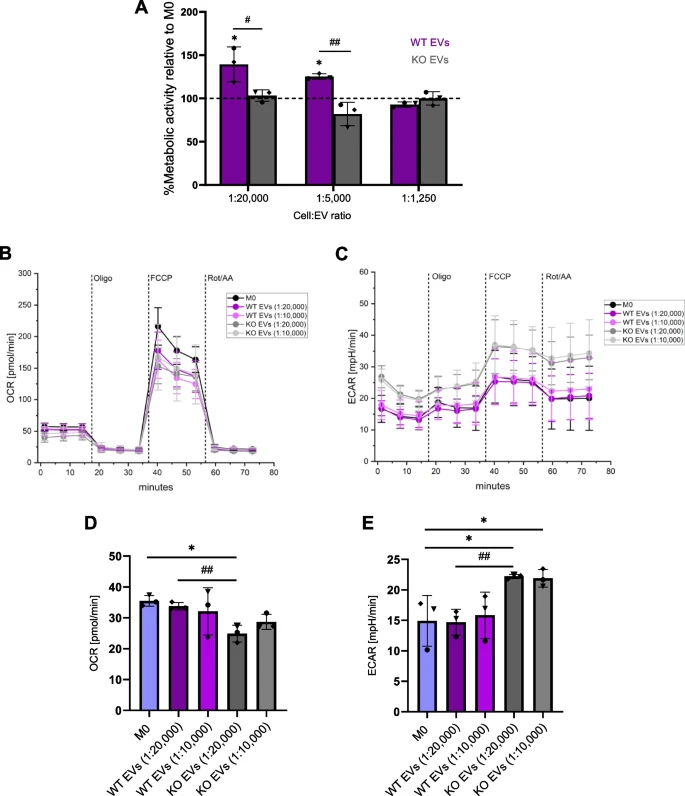
Fig. 9 EVs affect macrophage metabolism. A The metabolic activity of primary macrophages was measured using an MTT assay 24 h after polarization with EVs isolated with the TFF system (1:20,000–1:1,250 cell:EV ratios). Data are presented as a percentage of metabolic activity relative to non-polarized M0 (mean ± SD, n = 3 individual donors, triplicates). B-E M0 macrophages were polarized with EVs isolated with the TFF system at different cell:EV ratios (1:20,000 and 1:10,000) for 24 h. OCR and ECAR were measured with a mito stress test using a Seahorse® XFe96 Flux Analyzer. B Basal OCR. C ECAR in different macrophage subsets, and D, E Respective quantifications. Statistical analysis was performed using one-way ANOVA followed by Bonferroni's post-hoc test. Data are presented as mean ± SD (n = 3 individual donors, quintuplicate). * indicates a significant difference between treatments and M0. # shows a significant difference between WT and KO EVs