
Image
|
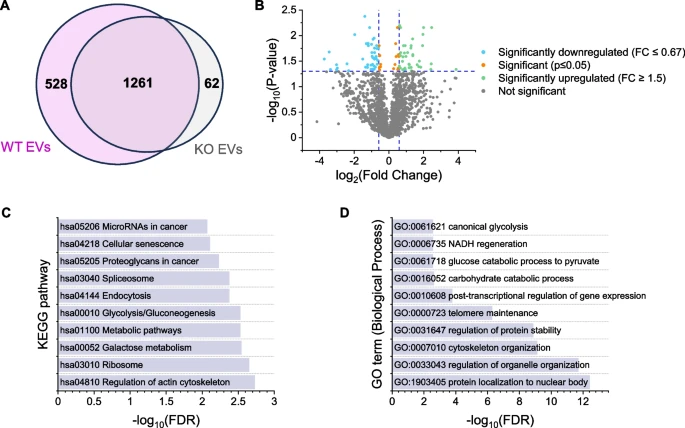
Figure Caption
Fig. 8 Proteomics data. A Total number of proteins detected in WT and KO EVs (= proteins with valid measurements in 3/3 preparations). B Differentially expressed proteins in KO vs. WT EVs. Log2 Fold Change is plotted against -log10 p-value. Proteins absent in one EV type are not shown. C, D KEGG Pathway (C) and GO term (D) enrichment for differentially abundant proteins
Acknowledgments
This image is the copyrighted work of the attributed author or publisher, and
ZFIN has permission only to display this image to its users.
Additional permissions should be obtained from the applicable author or publisher of the image.
Full text @ Cell Commun. Signal.