
- Title
-
Myeloid Targeted Human MLL-ENL and MLL-AF9 Induces cdk9 and bcl2 Expression in Zebrafish Embryos
- Authors
- Belt, A.J., Grant, S., Tombes, R.M., Rothschild, S.C.
- Source
- Full text @ PLoS Genet.
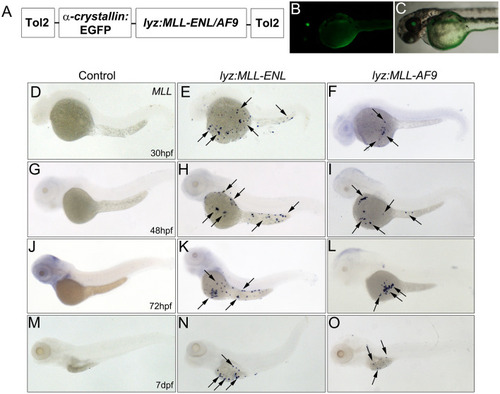
Diagram of the |
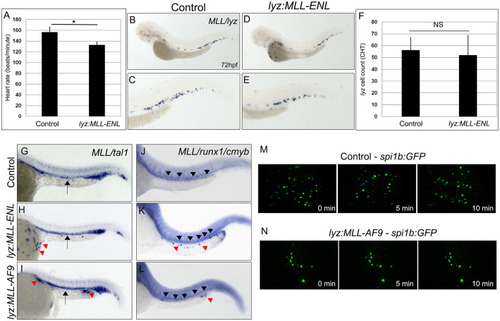
Accumulation of MLL positive cells on the yolk results from migration defects and not cardiovascular or hematopoietic defects. Average heart rates of control and |
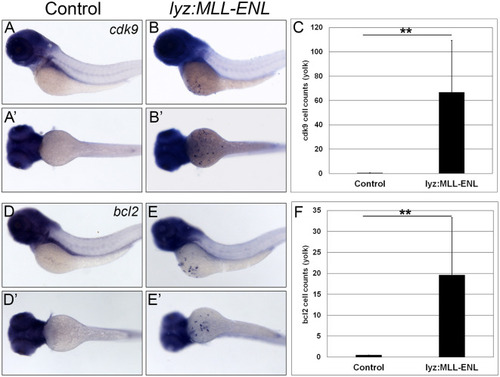
Expression of |
Expression of |
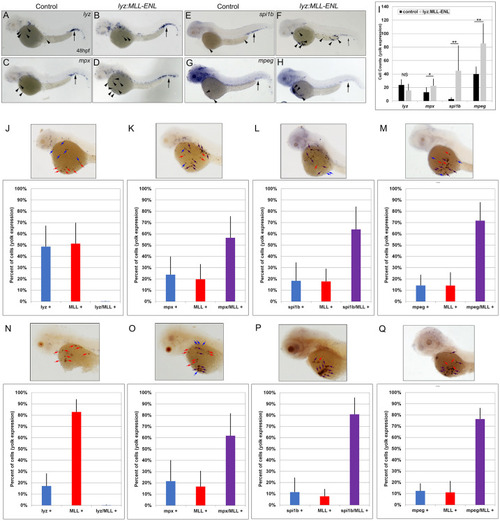
Myeloid targeted |
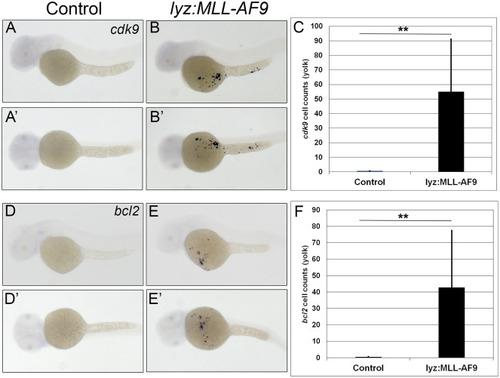
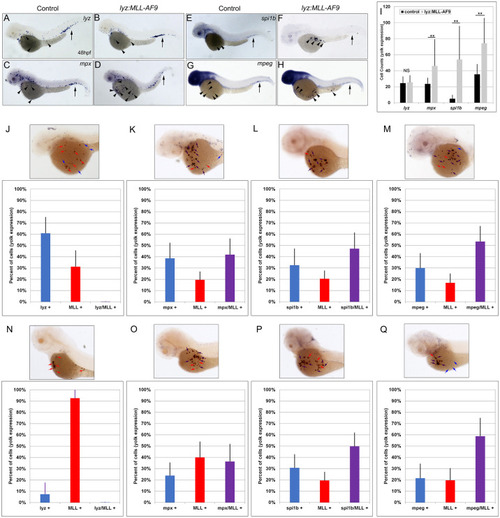
Myeloid targeted |
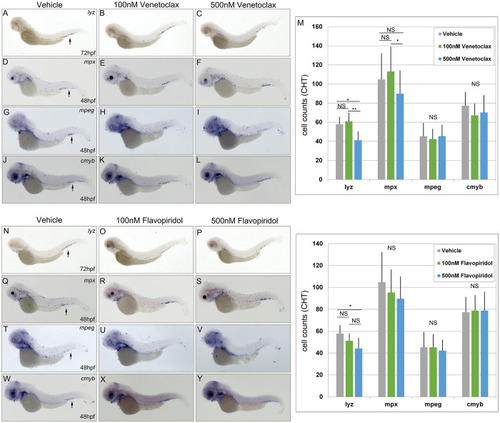
Dose dependent effect of Venetoclax and Flavopiridol on myelopoiesis. Embryos were treated with 100nM or 500nM of Venetoclax (A-M) or 100nM and 500nM Flavopiridol (N-Z) and assessed for expression of |
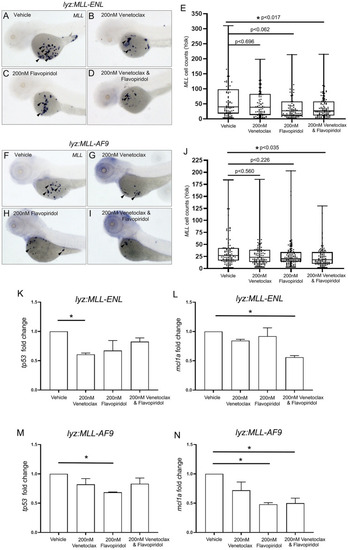
Venetoclax and Flavopiridol co-treatment significantly reduced |

ZFIN is incorporating published figure images and captions as part of an ongoing project. Figures from some publications have not yet been curated, or are not available for display because of copyright restrictions. EXPRESSION / LABELING:
|