
Image
|
Figure Caption
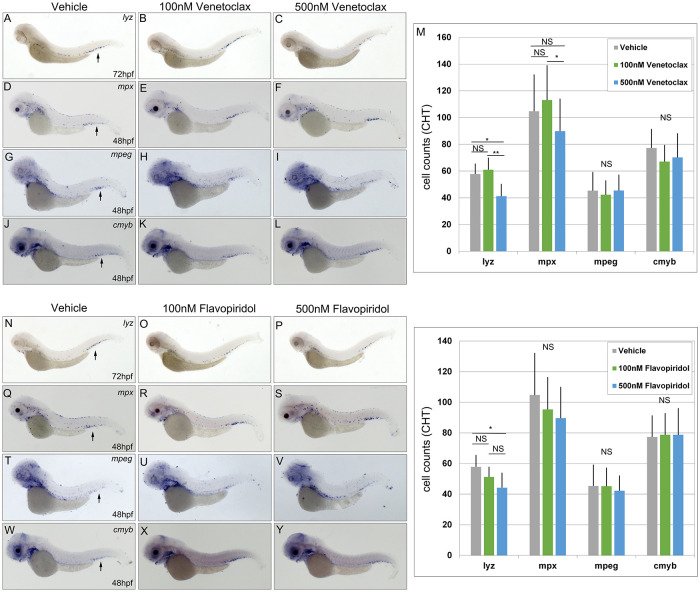
Fig 7 Dose dependent effect of Venetoclax and Flavopiridol on myelopoiesis.
Embryos were treated with 100nM or 500nM of Venetoclax (A-M) or 100nM and 500nM Flavopiridol (N-Z) and assessed for expression of
Acknowledgments
This image is the copyrighted work of the attributed author or publisher, and
ZFIN has permission only to display this image to its users.
Additional permissions should be obtained from the applicable author or publisher of the image.
Full text @ PLoS Genet.