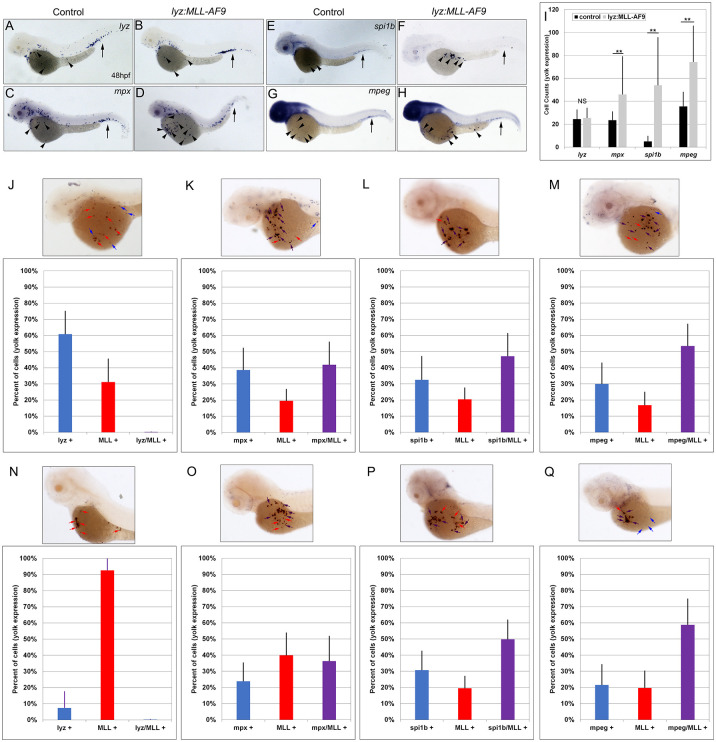
IMAGE

Fig 4

ID
ZDB-IMAGE-240614-66
Source
Figures for Belt et al., 2024
Image
Figure Caption

Fig 4 MLL expression colocalized with mpx, spi1b, and mpeg expression on the yolk of lyz:MLL-AF9 injected embryos at 48 and 72 hpf.

Expression of lyz, mpx, spi1b, and mpeg in control (A,C,E,G) and lyz:MLL-AF9 injected (B,D,F,H) embryos at 48 hpf. Black arrows indicate expression in the CHT, arrowheads indicate expression on the yolk (A-H). The number of cells on the yolk expressing lyz, mpx, spi1b, and mpeg was assessed at 48 hpf (I, N = 31–62). MLL colocalization with lyz (0%), mpx (41.9% +/- 14.0%), spi1b (47.1% +/-14.1%), and mpeg (53.4% +/- 13.6%) was determined at 48 hpf (J-M, N = 37–52) and with lyz (0%), mpx (36.6% +/- 15.4%), spi1b (49.8% +/- 12.0%), and mpeg (58.8% +/- 16.0%) at 72hpf (N-Q, N = 26–34). Blue, red, and purple bars indicate the percentage of cells stained on the yolk that were myeloid single positive (blue arrow), MLL single positive (red arrow), or myeloid marker/MLL double positive (purple arrow), respectively (J-Q). Statistical analysis was conducted using student’s t-test. * p<0.05, ** p<0.01, NS = not significant. Anterior to the left.

Acknowledgments
This image is the copyrighted work of the attributed author or publisher, and ZFIN has permission only to display this image to its users. Additional permissions should be obtained from the applicable author or publisher of the image. Full text @ PLoS Genet.