FIGURE SUMMARY
Title

Functional and Genetic Analyses Unveil the Implication of CDC27 in Hemifacial Microsomia

Authors
Song, W., Xia, X., Fan, Y., Zhang, B., Chen, X.
Source
Full text @ Int. J. Mol. Sci.

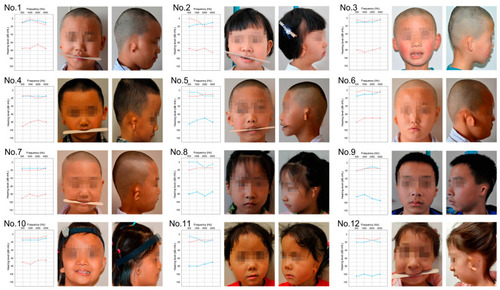
Phenotypic presentation and audiometry findings in 12 probands with hemifacial microsomia (HFM). The characteristic unilateral microtia (classified as Marx grading grade III) and the asymmetrical development of the mandible were presented in all probands, coupled with severe conductive hearing loss on the same side as assessed by pure tone audiometry. The blue line denotes the hearing threshold of the left ear, while the red line represents that of the right ear.

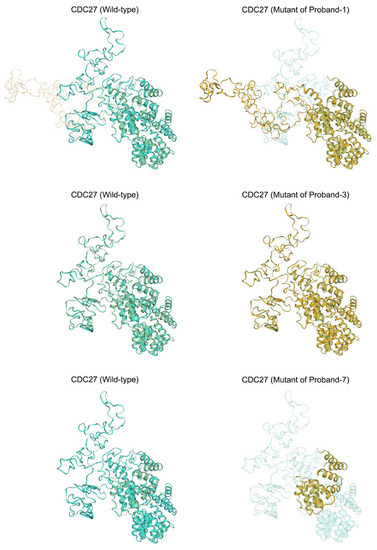
Comparative analysis of predicted tertiary structures in wild-type and mutant protein sequences near mutation sites. This figure presents structural superposition analyses to illustrate the alterations in protein structure resulting from the variants found in Proband I, Proband III, and Proband VII. Significant changes in the tertiary structure of the proteins due to the mutations were found in Proband I and Proband VII. In contrast, the predicted tertiary structure of the protein sequences flanking the variants from Proband III showed no discernible differences when compared to the wild-type structure, indicating that these particular mutations may not significantly alter the protein’s tertiary conformation.

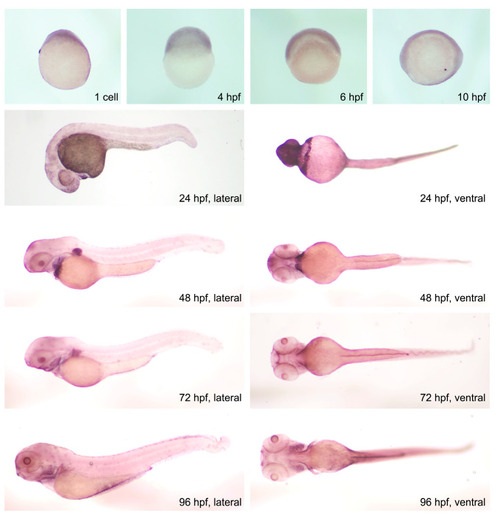
Temporal and spatial expression patterns of cdc27 in developing zebrafish embryos. In situ hybridization (ISH) results depict the dynamic expression pattern of cdc27 from the 1-cell stage through to 4 days post-fertilization (dpf), with images presented in both lateral and ventral views. Initially, at the 1-cell stage extending to 10 h post-fertilization (hpf), cdc27 is broadly expressed throughout the entire embryo. By 1 dpf, there is a notable upsurge in cdc27 expression, particularly in the head, eyes, trunk, and heart regions. As development progresses to 2 dpf, cdc27 expression becomes significantly concentrated in the pharyngeal arch region. This focused expression pattern in the pharyngeal arch region becomes even more pronounced from 3 to 4 dpf, underscoring the potential importance of cdc27 in the development of these specific anatomical structures.

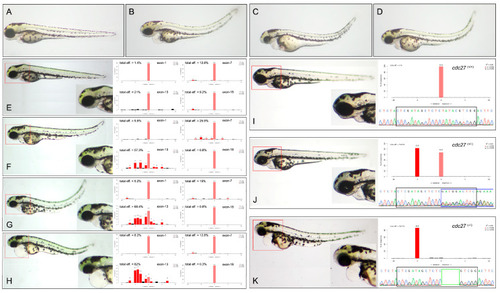
Comparison of phenotypes in wild-type and cdc27 gRNA injected zebrafish embryos. This figure presents the phenotypic differences observed in wild-type embryos (A) and those injected with cdc27 gRNAs (BD) at 3 days post-fertilization (dpf). In over 90% of the gRNA injected embryos, a notable reduction in the overall size of craniofacial structures, along with spine malformation and cardiac edema, was evident compared to control siblings. Panels (EH) illustrate the phenotypes and corresponding gene editing efficiency of embryos injected with four different gRNAs at 3 dpf. The severity of mandibular deformity in these embryos exhibited a progressive increase, with gRNA targeting exon-13 showing the highest gene editing efficiency. Moreover, a positive correlation was observed between the editing efficiency of gRNA (exon-13) and the severity of mandibular deformity. Panels (IK) depict phenotypes, Sanger sequencing chromatograms, and genotypes of F2 embryos. The F2 generation exhibited two distinct phenotypic categories and three different genotypes: embryos without deformities had either wild-type or heterozygous (5 bp deletion) genotypes, while those with deformities were exclusively homozygous for the 5 bp deletion. The red box highlights enlarged zebrafish structures, the black box denotes the sequence of gRNA (exon-13) (GTC GAT AGC TCT CTA TAC GTC GG), the blue box represents Sanger sequencing bimodal patterns, and the green box indicates the 5 bp deletion sequence (TATAC).

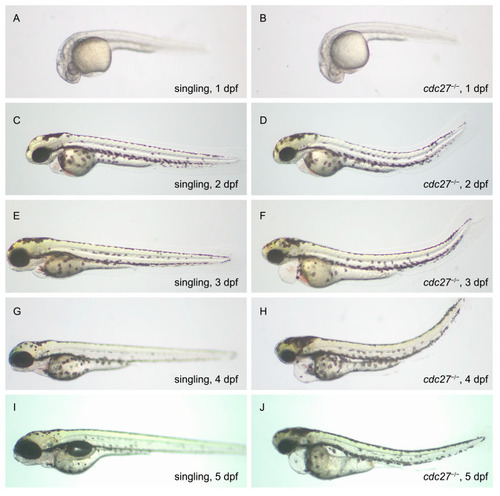
Phenotypic comparison between cdc27−/− mutants and wild-type zebrafish embryos from 1 to 5 days post-fertilization (dpf). This figure showcases the developmental progression and phenotypic variations observed in cdc27−/− mutant embryos compared to wild-type embryos from 1 dpf to 5 dpf. At 1 dpf (A,B), there are no significant phenotypic differences between the two groups. By 2 dpf (C,D), cdc27−/− embryos exhibit microcephaly, microphthalmia, and an abnormally curved spine, yet without noticeable abnormalities in the pharyngeal arch. At 3 dpf (E,F), the mutant embryos begin to show more pronounced phenotypic changes, including the absence of mandible structure formation, exacerbated spinal deformity, and the emergence of cardiac edema. These developmental anomalies, particularly the abnormal mandible development, persist in the mutant embryos at 4 dpf (G,H) and 5 dpf (I,J), highlighting the progressive nature of the craniofacial and skeletal deformities in cdc27−/− mutants.

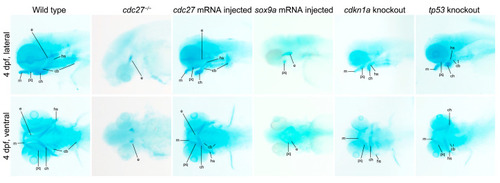
Alcian blue staining of pharyngeal arch cartilages in zebrafish embryos. This figure presents the staining results of pharyngeal arch cartilages using Alcian blue in various groups: wild-type, cdc27−/−, cdc27 mRNA injected, sox9a mRNA injected, cdkn1a knockout, and tp53 knockout embryos. Abbreviation: m, Meckel’s cartilages; pq, palatoquadrate cartilages; ch, ceratohyal cartilages; cb, ceratobranchial cartilages; hs, hyosymplectic cartilages; e, ethmoid plate cartilages.

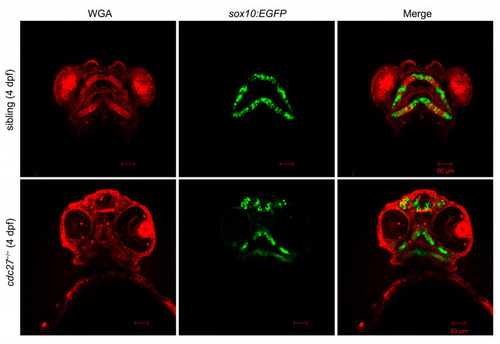
Comparative analysis of chondrocyte morphology in cdc27 mutants and control siblings using fluorescent WGA staining. This figure illustrates the results of fluorescent wheat germ agglutinin (WGA) staining at 4 days post-fertilization (dpf), showcasing the craniofacial cartilage formation in both control siblings and cdc27−/− mutant embryos. In the control siblings, the craniofacial cartilage demonstrates a highly consistent and stereotypical shape, akin to a “stack of pennies” where elongated and slender chondrocytes are meticulously arranged in layers, forming the individual cartilage elements. In stark contrast, the cdc27−/− embryos exhibit significantly altered chondrocyte morphology: the chondrocytes within the cartilage are noticeably smaller and the overall cartilage structures are markedly deformed, deviating substantially from the organized arrangement seen in the control siblings.

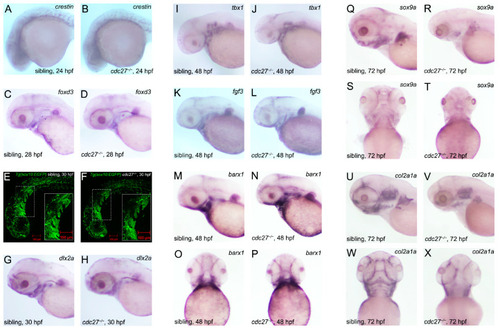
Investigating the impact of cdc27 knockout on pharyngeal pouches, neural crest cells (NCCs), and pharyngeal cartilage development in zebrafish embryos. This figure presents a series of in situ hybridization (ISH) and fluorescence imaging analyses to assess the developmental changes in cdc27−/− embryos compared to control siblings. (AD) ISH results with crestin and foxd3 probes at 24 h post-fertilization (hpf) and 28 hpf. The staining patterns for crestin and foxd3, markers for NCCs, show no noticeable differences between mutant embryos and their control siblings. (E,F) Fluorescence imaging of sox10-labeled NCCs in the pharyngeal arch region, marked by a white dotted box and enlarged in the solid white box. Green fluorescence signals indicating NCCs are similar in both cdc27−/− embryos and siblings. (G,H) ISH with the dlx2a probe at 30 hpf. Expression of dlx2a, a gene involved in craniofacial development, appears similar in both mutant and control embryos. (IL) ISH with tbx1 and fgf3 probes at 48 hpf. The results show no significant differences in the segmentation and number of pharyngeal pouches between cdc27−/− embryos and siblings. (MP) ISH with the barx1 probe at 48 hpf. No significant variation is observed in barx1 expression between mutant and control embryos. (QX) ISH with sox9a and col2a1a probes at 72 hpf. While sox9a expression is notably reduced in mutants, the expression of col2a1a, a marker for cartilage, is absent in the hypopharyngeal arches of the mutant embryos compared to controls, indicating a significant disruption in cartilage development.

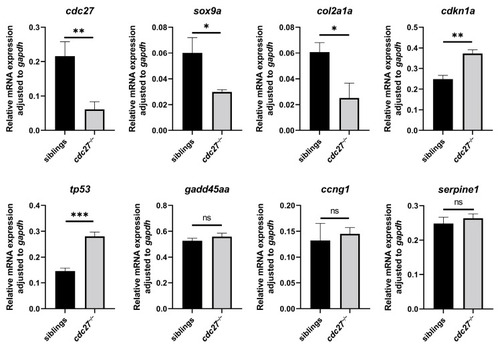
RT-qPCR analysis of gene expression in cdc27−/− mutant and control sibling zebrafish embryos. This figure illustrates the relative mRNA levels of several key genes, including cdc27, sox9a, col2a1a, cdkn1a, tp53, gadd45aa, ccng1, and serpine1, as determined by RT-qPCR analysis. In the cdc27−/− embryos, there is a notable decrease in the mRNA levels of cdc27, sox9a, and col2a1a, suggesting altered gene expression related to craniofacial development and cartilage formation. Conversely, the mRNA levels of cdkn1a and tp53 are elevated in the mutants, indicating potential compensatory mechanisms or stress responses. Notably, the mRNA levels of gadd45aa, ccng1, and serpine1 show no significant differences between the control siblings and cdc27−/− embryos, implying a selective impact of the cdc27 mutation on specific gene expressions. Note: *, p < 0.05; **, p < 0.01; ***, p < 0.001; ns, p > 0.05.

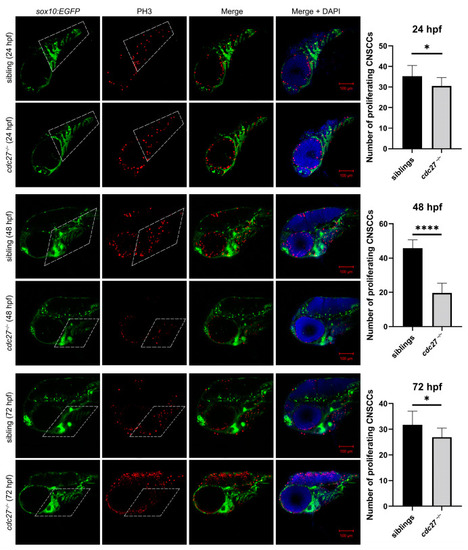
Comparison of CNCC proliferation in cdc27−/− mutants and control siblings at 24 h post-fertilization (hpf), 48 hpf, and 72 hpf. This figure presents immunofluorescence results depicting cell proliferation through antiphosphohistone H3 (PH3) staining in cdc27−/− mutants and their control siblings at different developmental stages. The merged images highlight the anti-PH3 signals in the CNCCs located in the pharyngeal arch region, marked by a dotted box. Note: *, p < 0.05; ****, p < 0.0001.

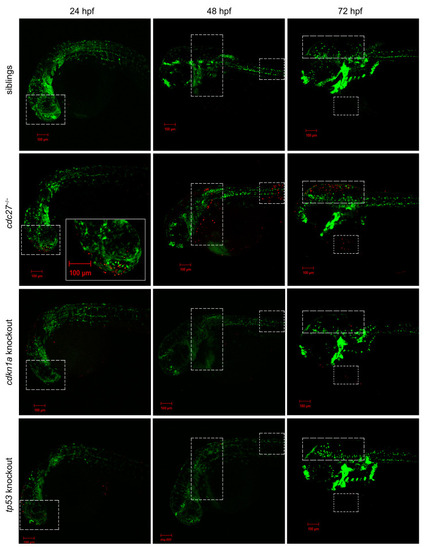
Analysis of somatic cell apoptosis in wild-type, cdc27−/−, cdkn1a knockout, and tp53 knockout zebrafish embryos at 24 h post-fertilization (hpf), 48 hpf, and 72 hpf. This figure displays the results of TUNEL staining, a method used to detect apoptosis in somatic cells, across different groups of embryos at various developmental stages. In the cdc27−/− mutant embryos, TUNEL staining signals, indicative of apoptotic cells, are observed in the head, trunk, spine, encephalocoele, and ventricle regions at 24, 48, and 72 hpf, respectively. In contrast, control siblings and embryos with cdkn1a or tp53 knockouts show no apparent apoptotic signals. The dotted boxes highlight areas of TUNEL staining, while the solid boxes provide enlarged views of these regions, emphasizing the specific areas where apoptosis is detected in the mutants.

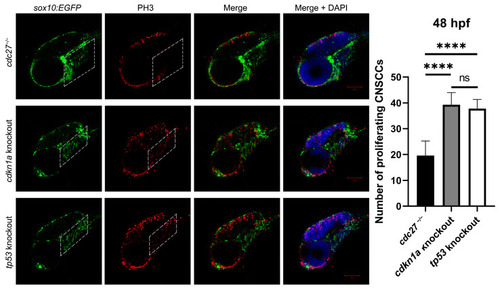
Comparative analysis of CNCC proliferation in cdc27−/−, cdkn1a, and tp53 knockout embryos at 48 h post-fertilization (hpf). This figure displays the results of immunofluorescence staining using antiphosphohistone H3 (PH3), a marker of cell proliferation, in three groups of zebrafish embryos: cdc27−/− mutants, cdkn1a knockouts, and tp53 knockouts. The merged images highlight anti-PH3 signals within the CNCCs in the pharyngeal arch region, marked by a dotted box. Notably, the intensity of these signals in cdkn1a and tp53 knockout embryos is increased compared to the cdc27−/− embryos, indicating a higher rate of cell proliferation in the pharyngeal arches of these knockouts. This suggests a variation in the proliferation rates of CNCCs due to different genetic modifications, with cdkn1a and tp53 knockouts exhibiting enhanced proliferation relative to the cdc27−/− mutants. Dotted box: pharyngeal arch reign. Note: ****, p < 0.0001.

Acknowledgments
This image is the copyrighted work of the attributed author or publisher, and ZFIN has permission only to display this image to its users. Additional permissions should be obtained from the applicable author or publisher of the image. Full text @ Int. J. Mol. Sci.