FIGURE

Figure 12

ID
ZDB-FIG-240513-66
Publication
Song et al., 2024 - Functional and Genetic Analyses Unveil the Implication of CDC27 in Hemifacial Microsomia
Other Figures
All Figure Page
Back to All Figure Page
Figure 12

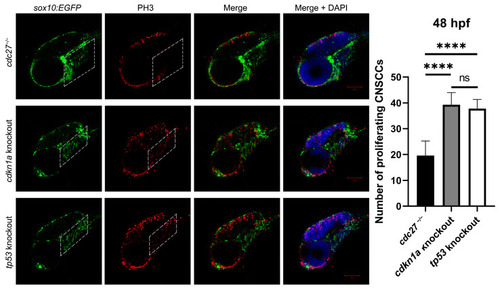
Comparative analysis of CNCC proliferation in cdc27−/−, cdkn1a, and tp53 knockout embryos at 48 h post-fertilization (hpf). This figure displays the results of immunofluorescence staining using antiphosphohistone H3 (PH3), a marker of cell proliferation, in three groups of zebrafish embryos: cdc27−/− mutants, cdkn1a knockouts, and tp53 knockouts. The merged images highlight anti-PH3 signals within the CNCCs in the pharyngeal arch region, marked by a dotted box. Notably, the intensity of these signals in cdkn1a and tp53 knockout embryos is increased compared to the cdc27−/− embryos, indicating a higher rate of cell proliferation in the pharyngeal arches of these knockouts. This suggests a variation in the proliferation rates of CNCCs due to different genetic modifications, with cdkn1a and tp53 knockouts exhibiting enhanced proliferation relative to the cdc27−/− mutants. Dotted box: pharyngeal arch reign. Note: ****, p < 0.0001.

Expression Data

Expression Detail
Antibody Labeling
Phenotype Data

Phenotype Detail
Acknowledgments
This image is the copyrighted work of the attributed author or publisher, and ZFIN has permission only to display this image to its users. Additional permissions should be obtained from the applicable author or publisher of the image. Full text @ Int. J. Mol. Sci.