
- Title
-
Artificial Lipid Biomembranes for Full-Length SARS-CoV-2 Receptor
- Authors
- Wang, T., Lin, X., Li, Y., Lu, Y.
- Source
- Full text @ Adv. Mater. Weinheim
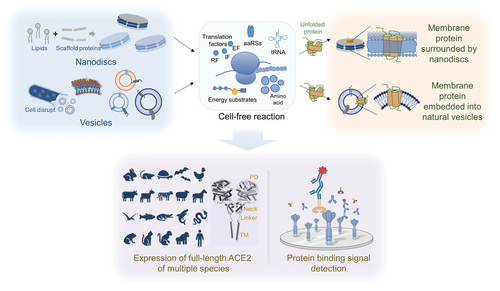
Synthesis of multispecies ACE2, including the peptidase domain (PD), neck domain, a long linker, and the single TM (TM) helix, was carried out in CFMPS, and functions of full-length ACE2 of multispecies were verified.[33] The process of ACE2 expression was conducted in a cell-free system using native membrane vesicles or additional nanomembrane structures. Additionally, the binding ability of ACE2 to RBD of SARS-CoV-2 spike protein was studied. |
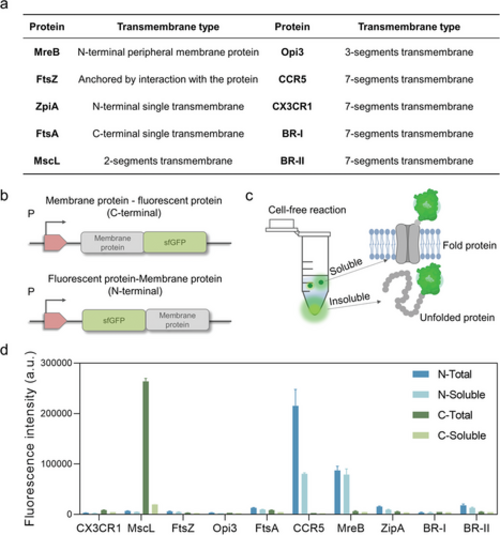
Cell-free expression of membrane proteins fused with N-terminal or C-terminal fluorescent proteins. a) Ten membrane proteins synthesized in cell-free systems. b) Design of membrane protein-fluorescent protein fusion proteins. c) Determining the hydrophobic support and structure of membrane proteins by measuring fluorescence values in supernatant and precipitate. d) Expression of fusion proteins in the cell-free system. Data presented as mean ± SD, n = 3. |

Preparation of cell-free membrane protein expression system using natural vesicles. a) During the preparation of cell extracts, disrupted cell membrane formed vesicles/membrane fragments, which allowed the expressed membrane proteins to be embedded or provided hydrophobic support to membrane proteins. b) Schematic diagram of size exclusion chromatography (SEC) of the cell-free system. In the cell-free system, the target membrane protein was detected by green fluorescence in the eluted peak. Lipid vesicles were detected by red fluorescence in the eluted peak. c) Different centrifugation rates could retain different sizes and numbers of cell membrane vesicles/membrane fragments. Cell extracts were centrifuged at 4000 × g (B4), 12 000 × g (B12), or 30 000 × g (B30) in the cell-free system for membrane protein expression. The fluorescence intensity (bar chart) represents the expression level of MscL-sfGFP. Solubility (broken line) represents the ratio of soluble protein to total expressed protein. T represents the fluorescence intensity of the total protein, and S represents the fluorescence intensity of the soluble (supernatant) protein. Data presented as mean ± SD, n = 3. d) Eluted peaks of three vesicle cell-free systems after SEC analysis. Among them, M4, M12, and M30 were the samples after the expression of membrane proteins by B4, B12, and B30 cell-free systems, respectively. The green peak represents the green fluorescence value (left ordinate) and denotes membrane proteins. The red peak represents the red fluorescence value (right ordinate) and denotes the vesicle fraction. e) Confocal micrographs of natural vesicles of M4, M12, and M30 cell-free systems (scale bar: 50 µm). |
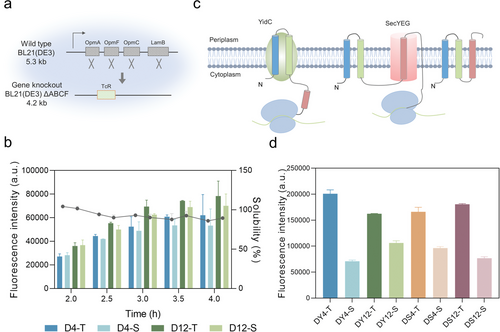
Membrane protein expression in cell-free systems of membrane protein knockout and insertase augmentation systems. a) Four genes, including OmpA (1041 bp), OmpF (1089 bp), OmpC (1104 bp), and LamB (1341 bp) of BL21(DE3) (≈5.3 kb), were knocked out, and tetracycline resistance (TcR) gene was added to obtain the strain BL21 (DE3) △ABCF (≈4.2 kb). b) Membrane protein expression in cell-free systems of membrane protein knockout system. D4 and D12 represent cell-free systems prepared using BL21 (DE3) △ABCF as cell extracts at centrifugation rates of 4000 × g and 12 000 × g, respectively. The fluorescence intensity (bar chart) represents the expression level of MscL-sfGFP. Solubility (broken line) represents the ratio of soluble protein to total expressed protein. c) Schematic diagram of membrane protein insertion enzyme YidC- and membrane protein transposon SecYEG-assisted membrane protein TM process. Data presented as mean ± SD, n = 3. d) Membrane protein expression in cell-free systems of insertase augmentation system. DY4 and DY12 represent cell-free systems containing YidC prepared at centrifugation rates of 4000 × g and 12 000 × g, respectively. DS4 and DS12 represent cell-free systems containing SecYEG prepared at centrifugation rates of 4000 × g and 12 000 × g, respectively. T represents the fluorescence intensity of the total protein, and S represents the fluorescence intensity of the soluble (supernatant) protein. |

Self-assembly of nanodiscs. a) Construction of nanodiscs. Membrane scaffold proteins enclosed lipids to form nanodiscs by self-assembly. b) Electron micrographs of self-assembled nanodiscs. The red arrow shows the structure of a typical nanodisc. |
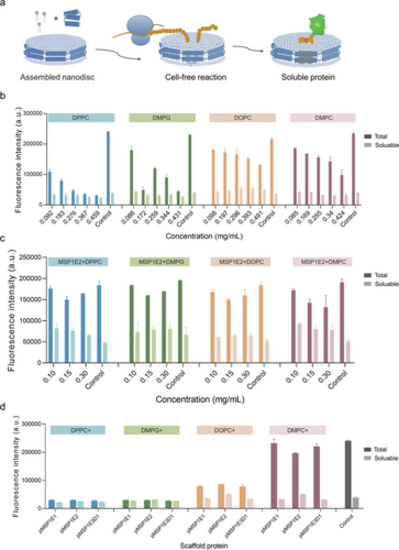
Cell-free membrane protein expression systems using nanodiscs. a) The assembled nanodiscs supported the membrane protein after being expressed in cell-free reactions. b) Effects of serial concentrations of four lipids on cell-free expression. Data presented as mean ± SD, n = 3. c) Effects of serial concentrations of four lipids with scaffold protein MSP1E2 on cell-free expression in a nanodisc environment. Data presented as mean ± SD, n = 3. d) Expression of membrane proteins in a cell-free system with the addition of nanodiscs composed of four lipids and three scaffold proteins. Dark columns represent the fluorescence intensity of total protein, and light columns represent the fluorescence intensity of soluble (supernatant) protein. Data presented as mean ± SD, n = 3. |

Expression of human ACE2-740 (hACE2-740) and its binding to spike protein of SARS-CoV-2. a) Structure of human ACE2 protein (Length: 805 aa). ACE2 is a single TM type I membrane protein, 18–615 aa is the peptidase domain (PD), and 616–805 aa is the collectrin-like domain (CLD) that contains the neck domain, a long linker, TM region, a single TM (TM) helix, and an ≈40-residue intracellular segment. The TM region connects the cytosolic side to the extracellular side. b) Structure of ACE2-RBD complex; orange and ochre colors represent RBD protomers. c) Representation of the ELISA used to detect the binding of ACE2 to RBD. d) Western blot of cell-free expression of hACE2-740, and the O.D. values of binding of cell-free expressed hACE2-740 and commercial hACE2-740 to RBD, as determined by ELISA (initial concentration: 0.5 mg mL−1). Data presented as mean ± SD, n = 3. |
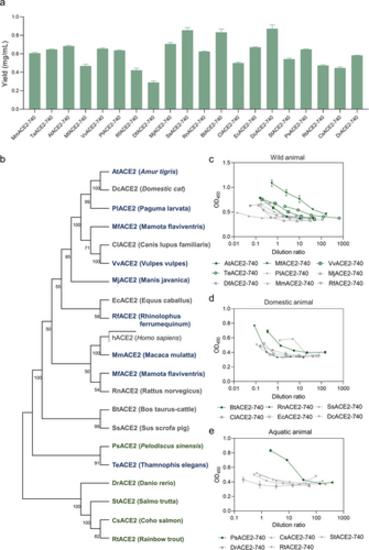
Expression of ACE2-740 in cell-free systems. a) Cell-free expression of ACE2-740 from 20 species. Data presented as mean ± SD, n = 3. b) The evolutionary tree of 20 species and Homo sapiens. Blue color indicates wild animals, green indicates domestic animals, and orange indicates aquatic animals. c) Results of binding assay of ACE2-740 from selected nine wild animals (initial concentration: 0.5 mg mL−1). Data presented as mean ± SD, n = 3. d) Results of binding assay of ACE2-740 from six selected domestic animals (initial concentration: 0.5 mg mL−1). Data presented as mean ± SD, n = 3. e) Binding assay results of ACE2-740 from five aquatic animals (initial concentration: 0.5 mg mL−1). For c, d, and e, dark green color represents ACE2-740 of species that exhibit strong binding, and gray indicates those displaying weak binding. Data presented as mean ± SD, n = 3. |

Expression of full-length hACE2 in vesicle and nanodisc cell-free systems. a) Results of western blotting of cell-free system expressing full-length hACE2 (hACE2, 92.5 kDa). b) Yield of total and soluble proteins of cell-free system expressing full-length hACE2. c,d) Results of binding assay of full-length hACE2 with RBD of SARS-CoV-2 in several cell-free systems (initial concentration: 0.5 mg mL−1). T and S represent the fluorescence intensity of total protein and soluble (supernatant) protein, respectively. Dark green color indicates systems with strong binding force, and gray indicates systems with weak binding force. Data presented as mean ± SD, n = 3. |
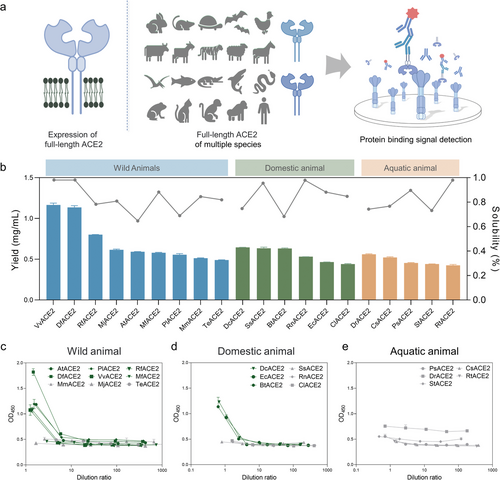
Expression and binding assays of multispecies full-length ACE2 in cell-free systems. a) Schematic diagram of multispecies full-length ACE2 expression and binding assays in cell-free systems. b) Results of cell-free expression and solubility of full-length ACE2 from 20 species. The expression yield of each protein was calculated according to the gray level analysis of standard protein samples and western blot bands. Data presented as mean ± SD, n = 3. c–e) Results of binding assays of soluble full-length ACE2 of 20 species with RBD (initial concentration: 0.5 mg mL−1). Dark green color indicates species with strong binding force, and gray indicates species with weak binding force. Data presented as mean ± SD, n = 3. |