
Fig. 4
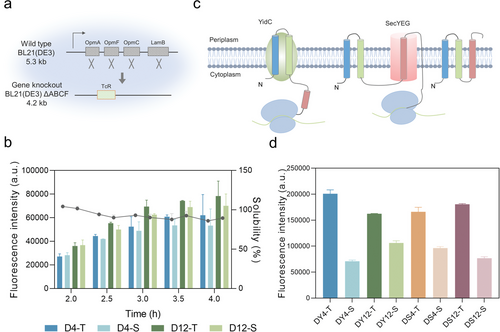
Membrane protein expression in cell-free systems of membrane protein knockout and insertase augmentation systems. a) Four genes, including OmpA (1041 bp), OmpF (1089 bp), OmpC (1104 bp), and LamB (1341 bp) of BL21(DE3) (≈5.3 kb), were knocked out, and tetracycline resistance (TcR) gene was added to obtain the strain BL21 (DE3) △ABCF (≈4.2 kb). b) Membrane protein expression in cell-free systems of membrane protein knockout system. D4 and D12 represent cell-free systems prepared using BL21 (DE3) △ABCF as cell extracts at centrifugation rates of 4000 × g and 12 000 × g, respectively. The fluorescence intensity (bar chart) represents the expression level of MscL-sfGFP. Solubility (broken line) represents the ratio of soluble protein to total expressed protein. c) Schematic diagram of membrane protein insertion enzyme YidC- and membrane protein transposon SecYEG-assisted membrane protein TM process. Data presented as mean ± SD, n = 3. d) Membrane protein expression in cell-free systems of insertase augmentation system. DY4 and DY12 represent cell-free systems containing YidC prepared at centrifugation rates of 4000 × g and 12 000 × g, respectively. DS4 and DS12 represent cell-free systems containing SecYEG prepared at centrifugation rates of 4000 × g and 12 000 × g, respectively. T represents the fluorescence intensity of the total protein, and S represents the fluorescence intensity of the soluble (supernatant) protein. |