
|
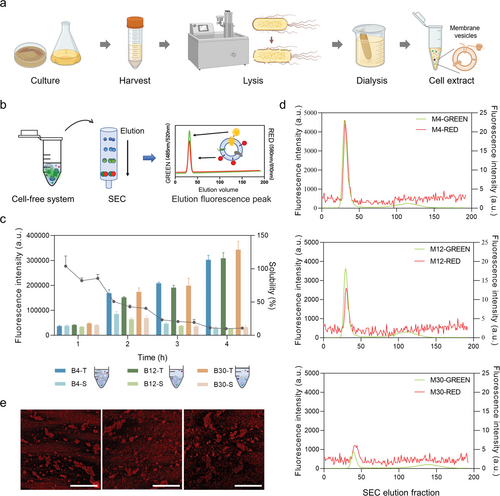
Fig. 3 Preparation of cell-free membrane protein expression system using natural vesicles. a) During the preparation of cell extracts, disrupted cell membrane formed vesicles/membrane fragments, which allowed the expressed membrane proteins to be embedded or provided hydrophobic support to membrane proteins. b) Schematic diagram of size exclusion chromatography (SEC) of the cell-free system. In the cell-free system, the target membrane protein was detected by green fluorescence in the eluted peak. Lipid vesicles were detected by red fluorescence in the eluted peak. c) Different centrifugation rates could retain different sizes and numbers of cell membrane vesicles/membrane fragments. Cell extracts were centrifuged at 4000 × g (B4), 12 000 × g (B12), or 30 000 × g (B30) in the cell-free system for membrane protein expression. The fluorescence intensity (bar chart) represents the expression level of MscL-sfGFP. Solubility (broken line) represents the ratio of soluble protein to total expressed protein. T represents the fluorescence intensity of the total protein, and S represents the fluorescence intensity of the soluble (supernatant) protein. Data presented as mean ± SD, n = 3. d) Eluted peaks of three vesicle cell-free systems after SEC analysis. Among them, M4, M12, and M30 were the samples after the expression of membrane proteins by B4, B12, and B30 cell-free systems, respectively. The green peak represents the green fluorescence value (left ordinate) and denotes membrane proteins. The red peak represents the red fluorescence value (right ordinate) and denotes the vesicle fraction. e) Confocal micrographs of natural vesicles of M4, M12, and M30 cell-free systems (scale bar: 50 µm).