
|
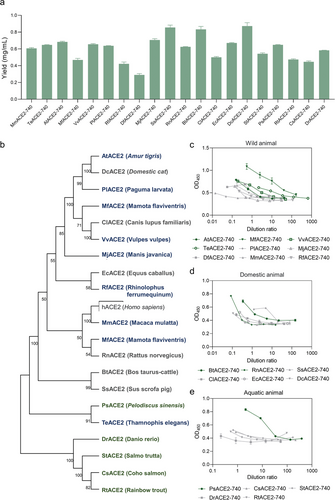
Fig. 8 Expression of ACE2-740 in cell-free systems. a) Cell-free expression of ACE2-740 from 20 species. Data presented as mean ± SD, n = 3. b) The evolutionary tree of 20 species and Homo sapiens. Blue color indicates wild animals, green indicates domestic animals, and orange indicates aquatic animals. c) Results of binding assay of ACE2-740 from selected nine wild animals (initial concentration: 0.5 mg mL−1). Data presented as mean ± SD, n = 3. d) Results of binding assay of ACE2-740 from six selected domestic animals (initial concentration: 0.5 mg mL−1). Data presented as mean ± SD, n = 3. e) Binding assay results of ACE2-740 from five aquatic animals (initial concentration: 0.5 mg mL−1). For c, d, and e, dark green color represents ACE2-740 of species that exhibit strong binding, and gray indicates those displaying weak binding. Data presented as mean ± SD, n = 3.