
|
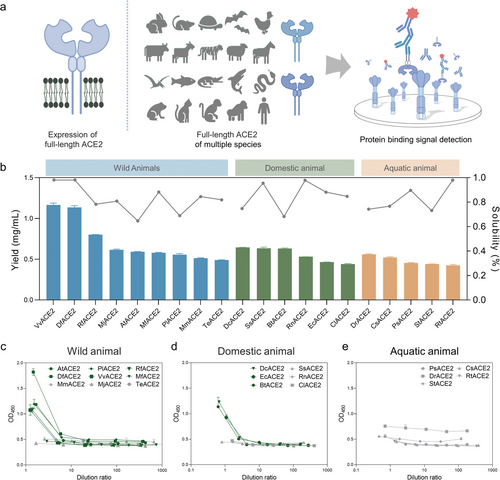
Fig. 10 Expression and binding assays of multispecies full-length ACE2 in cell-free systems. a) Schematic diagram of multispecies full-length ACE2 expression and binding assays in cell-free systems. b) Results of cell-free expression and solubility of full-length ACE2 from 20 species. The expression yield of each protein was calculated according to the gray level analysis of standard protein samples and western blot bands. Data presented as mean ± SD, n = 3. c–e) Results of binding assays of soluble full-length ACE2 of 20 species with RBD (initial concentration: 0.5 mg mL−1). Dark green color indicates species with strong binding force, and gray indicates species with weak binding force. Data presented as mean ± SD, n = 3.