
|
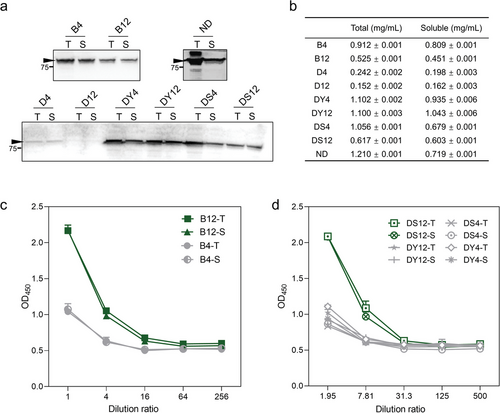
Fig. 9 Expression of full-length hACE2 in vesicle and nanodisc cell-free systems. a) Results of western blotting of cell-free system expressing full-length hACE2 (hACE2, 92.5 kDa). b) Yield of total and soluble proteins of cell-free system expressing full-length hACE2. c,d) Results of binding assay of full-length hACE2 with RBD of SARS-CoV-2 in several cell-free systems (initial concentration: 0.5 mg mL−1). T and S represent the fluorescence intensity of total protein and soluble (supernatant) protein, respectively. Dark green color indicates systems with strong binding force, and gray indicates systems with weak binding force. Data presented as mean ± SD, n = 3.