FIGURE SUMMARY
Title

Oxygen enhances antiviral innate immunity through maintenance of EGLN1-catalyzed proline hydroxylation of IRF3

Authors
Liu, X., Tang, J., Wang, Z., Zhu, C., Deng, H., Sun, X., Yu, G., Rong, F., Chen, X., Liao, Q., Jia, S., Liu, W., Zha, H., Fan, S., Cai, X., Gui, J.F., Xiao, W.
Source
Full text @ Nat. Commun.

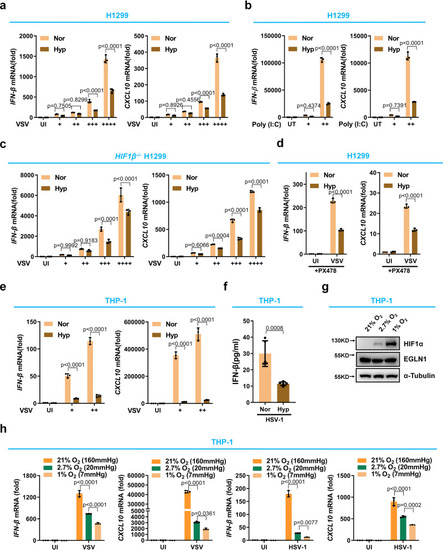
Hypoxia suppresses antiviral gene expression in response to viral infection independently of HIF signaling.
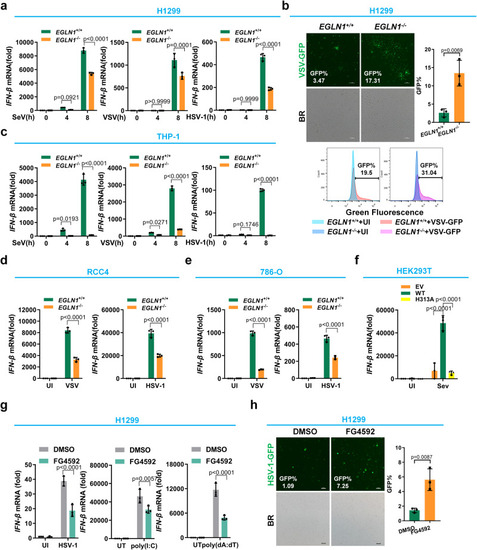
a qPCR analysis of IFN-β and CXCL10 mRNA in H1299 under normoxia (21% O2) or hypoxia (1% O2), infected without (UI) or with increasing amounts of VSV (+, 0.2 MOI (Multiplicity of Infection); ++, 0.5 MOI; +++, 1.0 MOI; ++++, 2.0 MOI) for 8 h. b qPCR analysis of IFN-β and CXCL10 mRNA in H1299 under normoxia (21% O2) or hypoxia (1% O2), transfected without (UT) or with increasing amounts of poly (I:C) (+, 0.5 μg/ml; ++, 1.0 μg/ml) for 8 h. c qPCR analysis of IFN-β and CXCL10 mRNA in HIF1β−/− H1299 under normoxia (21% O2) or hypoxia (1% O2), infected without or with increasing amounts of VSV (+, 0.2 MOI; ++, 0.5 MOI; +++, 1.0 MOI; ++++, 2.0 MOI) for 8 h. d qPCR analysis of IFN-β and CXCL10 mRNA in H1299 treated with PX478 (10 μM) under normoxia (21% O2) or hypoxia (1% O2), infected without or with VSV for 8 h. e qPCR analysis of IFN-β and CXCL10 mRNA in THP-1 under normoxia (21% O2) or hypoxia (1% O2), infected without or with increasing amounts of VSV (+, 1.0 MOI; ++, 2.0 MOI) for 8 h. f ELISA assay of IFN-β in THP-1 under normoxia (21% O2) or hypoxia (1% O2), infected with HSV-1 for 8 h. g Immunoblotting of HIF1α protein in THP-1 under physiological oxygen pressures (21% O2 (≈160 mmHg O2), 2.7% O2 (≈20 mmHg O2) and 1% O2 (≈7 mmHg O2)). h qPCR of IFN-β and CXCL10 mRNA in THP-1 under physiological oxygen pressure (21% O2, 2.7% O2 and 1% O2), infected without or with VSV (left two panels) or HSV-1 (right two panels). Data in (ae, h) are presented as mean ± S.D., two-way ANOVA; n = 3 biological independent experiments. Data in (f) are presented as mean ± S.D., two-tailed Student’s t test; n = 5 biological independent samples. Data in (g) are representative from three independent experiments. See also Supplementary Fig. 1. Source data are provided as a Source data file.

EGLN1 positively regulates cellular antiviral immune responses depending on its enzymatic activity.

a qPCR analysis of IFN-β mRNA in EGLN1+/+ and EGLN1−/− H1299 cells infected with SeV, VSV or HSV-1 for 0, 4 and 8 h. bEGLN1+/+ and EGLN1−/− H1299 cells were infected without (UI) or with VSV-GFP virus for 12 h, and viral infectivity was detected by fluorescence microscopy (top panels) or flow cytometry analysis (bottom panels). c qPCR analysis of IFN-β mRNA in EGLN1+/+ and EGLN1−/− THP-1 cells infected with SeV, VSV or HSV-1 for 0, 4 or 8 h. d qPCR analysis of IFN-β mRNA in EGLN1+/+ and EGLN1−/− RCC4 cells infected without (UI) or with VSV or HSV-1 for 8 h. e qPCR analysis of IFN-β mRNA in EGLN1+/+ and EGLN1−/− 786-O cells infected without (UI) or with VSV or HSV-1 for 8 h. f qPCR analysis of IFN-β mRNA in HEK293T cells transfected with the HA empty vector (EV), the plasmid expressing HA-EGLN1 (WT) or the plasmid expressing the enzymatically inactive mutant of EGLN1 (H313A) for 24 h, followed by infection without (UI) or with SeV for 8 h. g qPCR analysis of IFN-β in H1299 cells treated with DMSO (vehicle control) or FG4592 (20 μM) for 6 h, followed by infected without (UI) or with HSV-1 for 8 h, or transfected without (UT) or with poly (I:C) for 8 h, or transfected without (UT) or with poly (dA:dT) for 8 h. h H1299 cells were treated with DMSO (vehicle control) or FG4592 (20 μM) for 6 h, followed by infection without (UI) or with VSV-GFP virus for 12 h, and viral infectivity was detected by fluorescence microscopy analysis. BR, bright field. EGLN1−/− H1299 cells are clonal. Data in (a, cg) are presented as mean ± S.D., two-way ANOVA; n = 3 biological independent experiments. Data in (b, h) are presented as mean ± S.D., two-tailed Student’s t test; n = 3 biological independent experiments. See also Supplementary Figs. 25. Source data are provided as a Source data file.

Disruption of Egln1 in mice results in increased susceptibility to lethal viral infection.

a Scheme for CRISPR/Cas9-mediated genome editing. b Scheme for obtaining wild-type and Egln1-deficient BMDC (Cre-ER (ER= estrogen receptor) Egln1+/+ and Cre-ER Egln1fl/fl) and viral infection. c Cre-ER Egln1+/+ and Cre-ER Egln1fl/fl BMDC were infected with VSV-GFP for 12 h (n = 3 biological independent experiments). d qPCR analysis of VSV mRNA in Cre-ER Egln1+/+ and Cre-ER Egln1fl/fl BMDC infected with VSV for 0, 4, and 8 h. e ELISA assay of Ifn-β in supernatants of Cre-ER Egln1+/+ and Cre-ER Egln1fl/fl BMDC infected with VSV for 12 h (n = 6 biological independent samples). f Scheme for generation of Cre-ER Egln1+/+ and Cre-ER Egln1fl/fl mice and viral infection. g Validation of Egln1 protein in indicated tissues of Cre-ER Egln1+/+ and Cre-ER Egln1fl/fl mice. h H & E-stained images of lung sections from tamoxifen-treated Cre-ER Egln1+/+ and Cre-ER Egln1fl/fl mice injected intraperitoneally with PBS (phosphate buffer saline) or VSV (1 × 107 plaque-forming units (PFU) per mouse) for 24 h. Scale bar = 200 μm. i ELISA assay of Ifn-β in serum from tamoxifen-treated Cre-ER Egln1+/+ and Cre-ER Egln1fl/fl mice infected with VSV (1 × 107 PFU per mouse) for 24 h (n = 4 biological independent samples). j Survival of Cre-ER Egln1+/+ and Cre-ER Egln1fl/fl mice by injected intraperitoneally with VSV (1 × 107 PFU per mouse) and monitored for 10 d. Statistical analysis was performed using the log-rank test (n = 5 for each group). k Scheme for FG4592 treatment (10 mg/kg) and viral infection. l Survival of mice treated with vehicle control or FG4592 twice daily for 2 days, followed by intraperitoneal injection of VSV (5 × 107 PFU per mouse) and monitored for 8 days. Statistical analysis was performed using the log-rank test (n = 7 for each group). Data in (c, e, i) are presented as mean ± S.D., two-tailed Student’s t test. Data in (d) are presented as mean ± S.D., two-way ANOVA; n = 3 biological independent experiments. Data in (g, h) are representative from three independent experiments. See also Supplementary Fig. 6. Source data are provided as a Source data file.

Disruption or inhibition of egln1 in zebrafish results in increased susceptibility to lethal viral infection.

a Scheme for CRISPR/Cas9-mediated genome editing of the egln1a and egln1b gene locus; and the resulting sequence information in egln1a or egln1b null zebrafish. b Representative images of wild-type (egln1a+/+egln1b+/+) and egln1a and egln1b double knockout (egln1a−/−egln1b−/−) zebrafish larvae (3 dpf, n = 30) infected without (−) or with (+) GCRV-II for 18 h. The dead larvae showed lack of movement, curved body, and a bodily degeneration as indicated by the red arrows. c Survival (Kaplan–Meier curve) of wild-type (egln1a+/+egln1b+/+) and egln1a and egln1b double knockout (egln1a−/−egln1b−/−) zebrafish larvae (3 dpf) infected without (−) or with (+) GCRV-II for and monitored for 30 h. Statistical analysis was performed using the log-rank test (n = 30 for each group). d Representative images of zebrafish larvae (3 dpf) treated with DMSO (vehicle control) or FG4592 (10 μM) for 24 h, followed by infection without (−) or with SVCV (~6 × 107 TCID50/ml) for 24 h. The dead larvae showed lack of movement, curved body, and a bodily degeneration as indicated by the red arrows. e Survival (Kaplan–Meier curve) of zebrafish larvae (3 dpf) treated with DMSO (vehicle control) or FG4592 (10 μM) for 24 h, followed by infection without (–) or with SVCV (~6 × 107 TCID50/ml) and monitored for 40 h. Statistical analysis was performed using the log-rank test (n = 30 for each group). f Representative images of Tg(ifnφ1: mCherry) zebrafish larvae (8 dpf) treated with DMSO (vehicle control) or FG4592 (10 μM) for 12 h, followed by infected without (−) or with SVCV (~6 × 107 TCID50/ml) for 24 h. g Quantitation of total intensity in (f). UI uninfected. Data in (b, d, f) are representative from three independent experiments. Data in (g) are presented as mean ± S.D., two-way ANOVA; n = 3 biological independent experiments. See also Supplementary Figs. 7 and 8. Source data are provided as a Source data file.

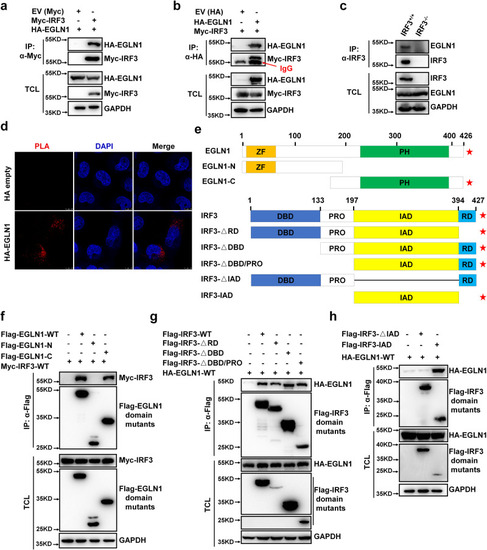
EGLN1 interacts with IRF3.

a, b Co-immunoprecipitation of Myc-IRF3 with HA-EGLN1 and vice versa. HEK293T cells were co-transfected with the indicated plasmids for 24 h. Anti-Myc or anti-HA antibody conjugated agarose beads were used for immunoprecipitation and the interaction was detected by immunoblotting with the indicated antibodies. c Endogenous interaction between IRF3 and EGLN1 in IRF3-deficient (IRF3−/−) or wild-type H1299 cells (IRF3+/+). d In situ PLA assays of the EGLN1-IRF3 interaction in H1299 cells with the indicated combinations using anti-HA and anti-IRF3 antibodies, scale bar = 10 µm. e Schematic of EGLN1 domains interacting with IRF3 domains. The positive result of the interaction is indicated by the (★) signs. f Co-immunoprecipitation analysis of Myc-IRF3 with Flag-EGLN1 truncated mutants. HEK293T cells were co-transfected with the indicated plasmids. Anti-Flag antibody conjugated agarose beads were used for immunoprecipitation and the interaction was analyzed by immunoblotting with anti-Myc antibody. Flag-EGLN1 fragments (WT: full length; N, 1–196 aa; C, 130–426 aa). g, h Co-immunoprecipitation analysis of HA-EGLN1 with Flag-IRF3 truncated mutants. HEK293T cells were co-transfected with the indicated plasmids. Anti-Flag antibody conjugated agarose beads were used for immunoprecipitation and the interaction was analyzed by immunoblotting with anti-HA antibody. Flag-IRF3 fragments (WT: full length; ΔRD, 1–394 aa; ΔDBD, 133–427 aa; ΔDBD&PRO, 197–427 aa; ΔIAD, 1–197 & 394–427 aa; IAD, 197–394 aa). Flag-IRF3-ΔDBD&PRO expression was relatively lower compared to other fragments, its band was independently excised for longer exposure. EV empty vector, IP immunoprecipitation, TCL total cell lysates, PLA proximity ligation assay. Data in (ad, fh) are representative from three independent experiments. See also Supplementary Figs. 9 and 10. Source data are provided as a Source data file.

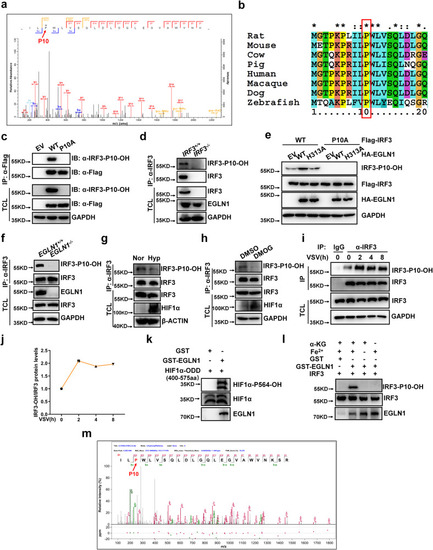
EGLN1 hydroxylates IRF3 at proline 10.

a The hydroxylated residue in IRF3 was identified by mass spectrometry analysis. b Sequence alignment of partial IRF3 (1–20 amino acids). c HEK293T were transfected with the Flag empty vector (EV), Flag-IRF3 or Flag-IRF3-P10A, followed by immunoprecipitation and immunoblotting with the indicated antibodies. d Cell lysates from IRF3+/+ and IRF3−/− H1299 were extracted, followed by immunoprecipitation and immunoblotting with the indicated antibodies. eEGLN1−/− H1299 were transfected with Flag-IRF3-WT or Flag-IRF3-P10A, together with the HA empty vector (EV), HA-EGLN1-WT (WT), HA-EGLN1-H313A (H313A), followed by immunoprecipitation and immunoblotting with the indicated antibodies. f Cell lysates from EGLN1+/+ and EGLN1−/− H1299 were extracted, followed by immunoprecipitation and immunoblotting with the indicated antibodies. g Cell lysates from THP-1 under normoxia (21% O2) or hypoxia (1% O2) for 12 h were extracted, followed by immunoprecipitation and immunoblotting with the indicated antibodies. h Cell lysates from THP-1 treated with DMSO (vehicle control) or DMOG (1 mM) for 6 h were extracted, followed by immunoprecipitation and immunoblotting with the indicated antibodies. i Cell lysates from H1299 infected with VSV virus for the indicated time were extracted, followed by immunoprecipitation and immunoblotting with the indicated antibodies. j Quantitation of the intensity of hydroxylated IRF3/total IRF3 protein in (i). k Bacterially expressed HIF1α (400-575aa) (GST tag has been removed using thrombin) incubated with bacterially expressed GST or bacterially expressed GST-EGLN1 for hydroxylation reaction and then detected by immunoblotting with anti-HIF1α-P564-OH antibody. l In vitro hydroxylation assay to detect bacterially expressed IRF3 hydroxylated by bacterially expressed GST-EGLN1. m Bacterially expressed IRF3 (GST tag has been removed using thrombin) was incubated with bacterially expressed GST-EGLN1 for hydroxylation reaction and then identified by mass spectrometry analysis. Hydroxylated IRF3-P10 is indicated by the red arrow, and the percentage of IRF3 hydroxylation is 10.34%. EV empty vector, IP immunoprecipitation, TCL total cell lysates. Data in (ci, k, l) are representative from three independent experiments. See also Supplementary Fig. 11. Source data are provided as a Source data file.

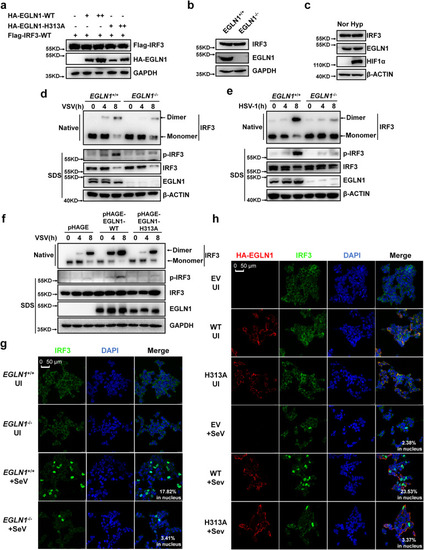
EGLN1 enhances IRF3 phosphorylation, dimerization, and nuclear translocation.

a Immunoblotting of the indicated protein expression in HEK293T cells transfected with the plasmid expressing Flag-tagged IRF3 together with increasing amounts of HA-EGLN1 or HA-EGLN1-H313A. b Immunoblotting of the indicated protein expression in EGLN1+/+ or EGLN1−/− H1299 cells. c Immunoblotting of the indicated protein expression in H1299 cells under normoxia (Nor) (21% O2) and hypoxia (Hyp) (1% O2) for 4 h. dEGLN1+/+ and EGLN1−/− THP-1 cells were infected with VSV for the indicated times, and the cell lysates were analyzed by immunoblotting for monomeric (Monomer) and dimeric (Dimer) IRF3 (top; native-PAGE); phosphorylated IRF3 (p-IRF3), total IRF3, EGLN1, and β-ACTIN (bottom; SDS-PAGE). eEGLN1+/+ and EGLN1−/− THP-1 cells were infected with HSV-1 for the indicated times, and the cell lysates were analyzed by immunoblotting for monomeric (Monomer) and dimeric (Dimer) IRF3 (top; native-PAGE); phosphorylated IRF3 (p-IRF3), total IRF3, EGLN1, and β-ACTIN (bottom; SDS-PAGE). fEGLN1−/− H1299 cells stably expressed pHAGE empty vector, wild-type EGLN1 (WT) or the enzymatically inactive mutant (H313A) by lentivirus were infected with VSV for the indicated times, and the cell lysates were analyzed by immunoblotting for monomeric (monomer) and dimeric (dimer) IRF3 (top, native-PAGE); phosphorylated IRF3 (p-IRF3), total IRF3, EGLN1, and GAPDH (bottom; SDS-PAGE). gEGLN1+/+ or EGLN1−/− HEK293T cells were infected without (UI) or with SeV for 8 h and confocal microscopy image of endogenous IRF3 was detected by immunofluorescence staining using anti-IRF3 antibody. Scale bar = 50 µm. hEGLN1−/− HEK293T cells were transfected with the HA empty vector (EV), the plasmid expressing HA-tagged wild-type EGLN1 (WT) or the plasmid expressing the enzymatically inactive mutant (H313A), followed by infected without (UI) or with SeV for 8 h. Confocal microscopy image of endogenous IRF3 was detected by immunofluorescence staining using anti-IRF3 antibody and HA-tagged EGLN1 or its mutant (H313A) was detected by immunofluorescence staining with anti-HA antibody. Scale bar = 50 µm. Data in (ah) are representative from three independent experiments. See also Supplementary Fig. 12. Source data are provided as a Source data file.

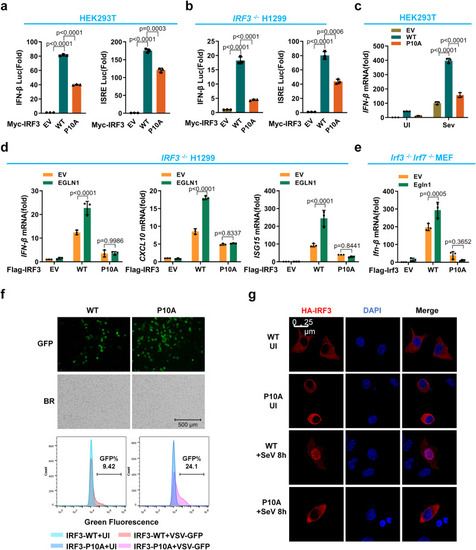
Hydroxylation of IRF3 at proline 10 enhances IRF3 activation and nuclear translocation in cellular antiviral immune responses.

a IFN-β promoter activity and ISRE reporter activity in HEK293T transfected with the Myc empty vector (EV) or the plasmid expressing wild-type IRF3 (WT) or its mutant (P10A). b IFN-β promoter activity and ISRE reporter activity in IRF3−/− H1299 cells transfected with the Myc empty vector or the plasmid expressing wild-type IRF3 or its mutant (P10A). c qPCR analysis of IFN-β mRNA in HEK293T transfected with the empty vector or the plasmid expressing wild-type IRF3 (WT) or its mutant (P10A), followed by infected without (UI) or with SeV for 8 h. d qPCR analysis of IFN-β, CXCL10 and ISG15 mRNA in IRF3−/− H1299 transfected with the empty Flag vector or the plasmid expressing Flag-tagged wild-type IRF3 or its mutant (P10A), together with the empty Myc vector or the plasmid expressing Myc-tagged EGLN1 (EGLN1). e qPCR analysis of Ifn-β mRNA in Irf3 and Irf7-deficient MEF (Irf3−/−Irf7−/−) transfected with the empty Flag vector or the plasmid expressing Flag-tagged wild-type Irf3 or its mutant (P10A), together with the empty Myc vector or the plasmid expressing Myc-tagged Egln1 (Egln1). fIRF3−/− H1299 were transfected with the plasmid expressing Flag-tagged wild-type IRF3 or its mutant (P10A) for 24 h, followed by infection without or with VSV-GFP viruses for 12 h, and viral infectivity was detected by fluorescence microscopy or flow cytometry analysis (bottom panels). gIRF3−/− H1299 were transfected with the plasmid expressing HA-tagged wild-type IRF3 or P10A mutant (P10A), followed by infection without or with SeV for 8 h. Confocal microscopy image of exogenous IRF3 was detected by immunofluorescence staining with anti-HA antibody. Scale bar = 25 µm. BR, bright field. Data in (a, b) are presented as mean ± S.D., two-tailed Student’s t test; n = 3 biological independent experiments. Data in (ce) are presented as mean ± S.D., two-way ANOVA; n = 3 biological independent experiments. Data in (f, g) are representative from three independent experiments. See also Supplementary Fig. 13. Source data are provided as a Source data file.

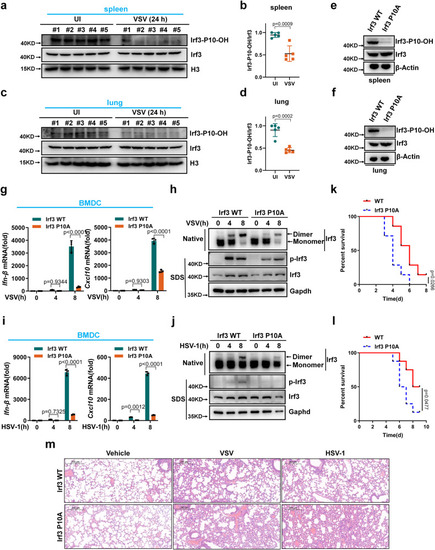
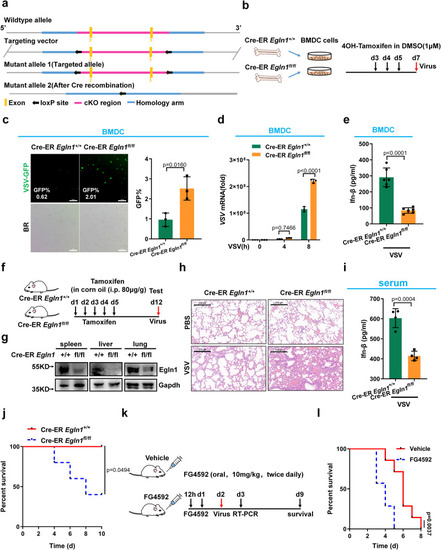
Irf3 prolyl hydroxylation deficiency attenuates antiviral innate immunity in mice.

a Irf3 prolyl hydroxylation in spleen of wild-type mice infected without (UI) or with VSV for 24 h. b Quantitation of Irf3 prolyl hydroxylation in (a). c Irf3 prolyl hydroxylation in lung of WT mice infected without or with VSV for 24 h. d Quantitation of Irf3 prolyl hydroxylation in (c). e, f Proteins in spleen (e) and lung (f) of Irf3_P10A mutant and WT littermates (Irf3_P10A and Irf3-WT). g qPCR analysis of Ifn-β and Cxcl10 mRNA in WT or Irf3_P10A mutant BMDCs (Irf3-WT or Irf3_P10A) infected with VSV. h WT or Irf3_P10A mutant BMDCs (Irf3-WT or Irf3_P10A) were infected with VSV for the indicated times, and the cell lysates were analyzed by immunoblotting. i qPCR analysis of Ifn-β and Cxcl10 mRNA in WT or Irf3_P10A-mutant BMDCs (Irf3-WT or Irf3_P10A) infected with HSV-1. j WT or Irf3_P10A mutant BMDCs (Irf3-WT or Irf3_P10A) were infected with HSV-1 for the indicated times, and the cell lysates were analyzed by immunoblotting. k Survival (Kaplan-Meier curve) of WT mice and Irf3_P10A mutant mice injected intraperitoneally with a high dose of VSV (5 × 107 PFU per mouse). Statistical analysis was performed using the log-rank test (n = 7 for each group). l Survival of WT mice and Irf3_P10A mutant mice injected intraperitoneally with a high dose of HSV-1 (5 × 107 PFU per mouse). Statistical analysis was performed using the log-rank test (n = 8 for each group). m H & E stained images of lung sections from WT or Irf3_P10A mutant mice (Irf3-WT or Irf3_P10A) injected intraperitoneally with PBS (phosphate buffer saline), VSV (5 × 107 PFU per mouse) or HSV-1 (5 × 107 PFU per mouse) for 24 h. Data in (a, c, e, f, h, j, m) are representative from three independent experiments. Data in (b, d) are presented as mean ± S.D., two-tailed Student’s t test; n = 5 biological independent samples. Data in (g, i) are presented as mean ± S.D., two-way ANOVA; n = 3 biological independent experiments. See also Supplementary Figs. 1416. Source data are provided as a Source data file.

Acknowledgments
This image is the copyrighted work of the attributed author or publisher, and ZFIN has permission only to display this image to its users. Additional permissions should be obtained from the applicable author or publisher of the image. Full text @ Nat. Commun.