|
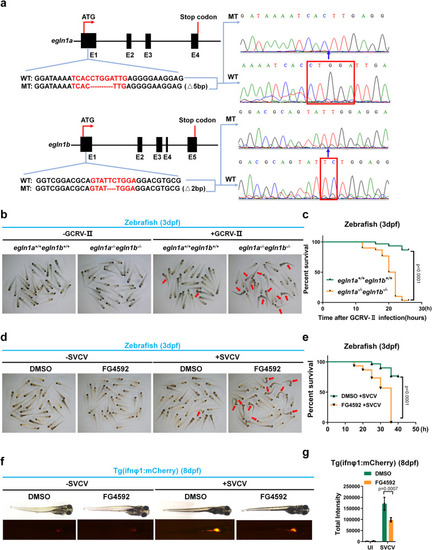
Disruption or inhibition of egln1 in zebrafish results in increased susceptibility to lethal viral infection. a Scheme for CRISPR/Cas9-mediated genome editing of the egln1a and egln1b gene locus; and the resulting sequence information in egln1a or egln1b null zebrafish. b Representative images of wild-type (egln1a+/+egln1b+/+) and egln1a and egln1b double knockout (egln1a−/−egln1b−/−) zebrafish larvae (3 dpf, n = 30) infected without (−) or with (+) GCRV-II for 18 h. The dead larvae showed lack of movement, curved body, and a bodily degeneration as indicated by the red arrows. c Survival (Kaplan–Meier curve) of wild-type (egln1a+/+egln1b+/+) and egln1a and egln1b double knockout (egln1a−/−egln1b−/−) zebrafish larvae (3 dpf) infected without (−) or with (+) GCRV-II for and monitored for 30 h. Statistical analysis was performed using the log-rank test (n = 30 for each group). d Representative images of zebrafish larvae (3 dpf) treated with DMSO (vehicle control) or FG4592 (10 μM) for 24 h, followed by infection without (−) or with SVCV (~6 × 10⁷ TCID50/ml) for 24 h. The dead larvae showed lack of movement, curved body, and a bodily degeneration as indicated by the red arrows. e Survival (Kaplan–Meier curve) of zebrafish larvae (3 dpf) treated with DMSO (vehicle control) or FG4592 (10 μM) for 24 h, followed by infection without (–) or with SVCV (~6 × 10⁷ TCID50/ml) and monitored for 40 h. Statistical analysis was performed using the log-rank test (n = 30 for each group). f Representative images of Tg(ifnφ1: mCherry) zebrafish larvae (8 dpf) treated with DMSO (vehicle control) or FG4592 (10 μM) for 12 h, followed by infected without (−) or with SVCV (~6 × 10⁷ TCID50/ml) for 24 h. g Quantitation of total intensity in (f). UI uninfected. Data in (b, d, f) are representative from three independent experiments. Data in (g) are presented as mean ± S.D., two-way ANOVA; n = 3 biological independent experiments. See also Supplementary Figs. 7 and 8. Source data are provided as a Source data file.
|