|
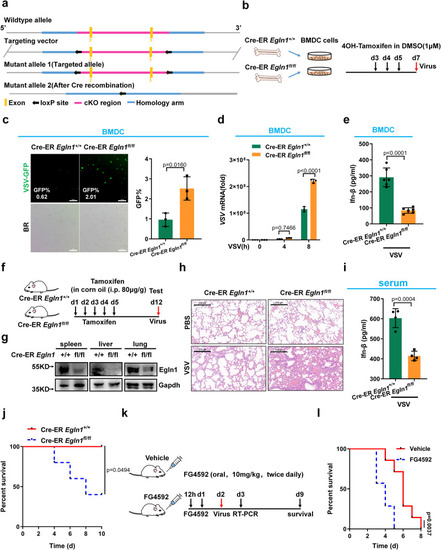
Disruption of Egln1 in mice results in increased susceptibility to lethal viral infection. a Scheme for CRISPR/Cas9-mediated genome editing. b Scheme for obtaining wild-type and Egln1-deficient BMDC (Cre-ER (ER= estrogen receptor) Egln1+/+ and Cre-ER Egln1fl/fl) and viral infection. c Cre-ER Egln1+/+ and Cre-ER Egln1fl/fl BMDC were infected with VSV-GFP for 12 h (n = 3 biological independent experiments). d qPCR analysis of VSV mRNA in Cre-ER Egln1+/+ and Cre-ER Egln1fl/fl BMDC infected with VSV for 0, 4, and 8 h. e ELISA assay of Ifn-β in supernatants of Cre-ER Egln1+/+ and Cre-ER Egln1fl/fl BMDC infected with VSV for 12 h (n = 6 biological independent samples). f Scheme for generation of Cre-ER Egln1+/+ and Cre-ER Egln1fl/fl mice and viral infection. g Validation of Egln1 protein in indicated tissues of Cre-ER Egln1+/+ and Cre-ER Egln1fl/fl mice. h H & E-stained images of lung sections from tamoxifen-treated Cre-ER Egln1+/+ and Cre-ER Egln1fl/fl mice injected intraperitoneally with PBS (phosphate buffer saline) or VSV (1 × 10⁷ plaque-forming units (PFU) per mouse) for 24 h. Scale bar = 200 μm. i ELISA assay of Ifn-β in serum from tamoxifen-treated Cre-ER Egln1+/+ and Cre-ER Egln1fl/fl mice infected with VSV (1 × 10⁷ PFU per mouse) for 24 h (n = 4 biological independent samples). j Survival of Cre-ER Egln1+/+ and Cre-ER Egln1fl/fl mice by injected intraperitoneally with VSV (1 × 10⁷ PFU per mouse) and monitored for 10 d. Statistical analysis was performed using the log-rank test (n = 5 for each group). k Scheme for FG4592 treatment (10 mg/kg) and viral infection. l Survival of mice treated with vehicle control or FG4592 twice daily for 2 days, followed by intraperitoneal injection of VSV (5 × 10⁷ PFU per mouse) and monitored for 8 days. Statistical analysis was performed using the log-rank test (n = 7 for each group). Data in (c, e, i) are presented as mean ± S.D., two-tailed Student’s t test. Data in (d) are presented as mean ± S.D., two-way ANOVA; n = 3 biological independent experiments. Data in (g, h) are representative from three independent experiments. See also Supplementary Fig. 6. Source data are provided as a Source data file.
|