IMAGE

Fig. 8

ID
ZDB-IMAGE-240429-54
Source
Figures for Liu et al., 2024
Image
Figure Caption

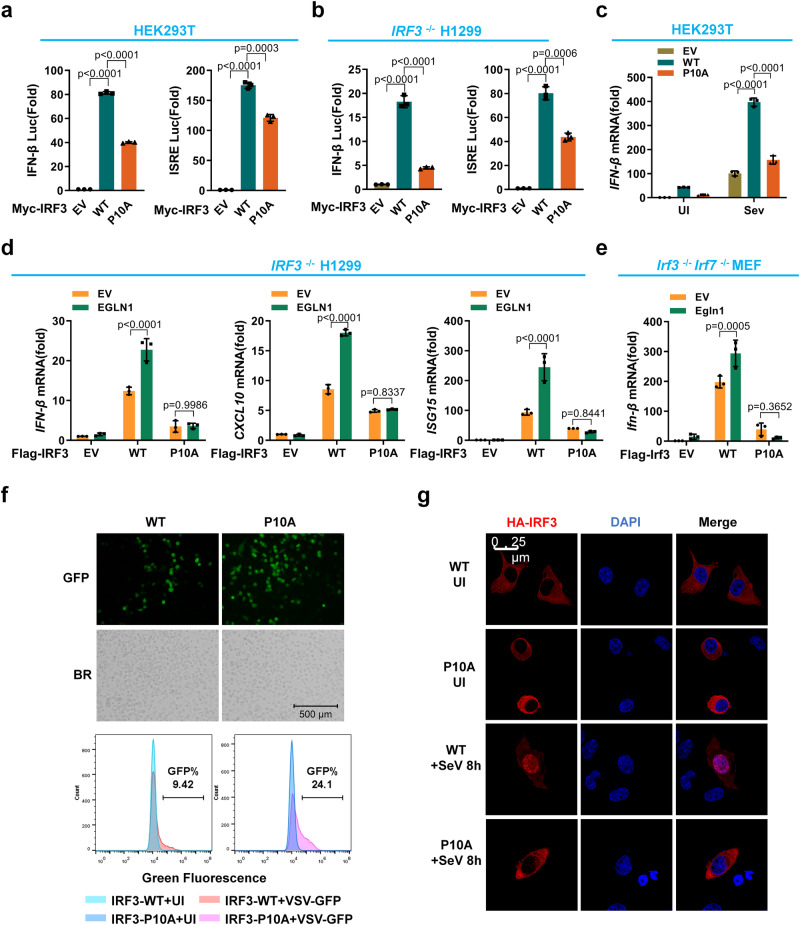
Fig. 8 Hydroxylation of IRF3 at proline 10 enhances IRF3 activation and nuclear translocation in cellular antiviral immune responses.

a IFN-β promoter activity and ISRE reporter activity in HEK293T transfected with the Myc empty vector (EV) or the plasmid expressing wild-type IRF3 (WT) or its mutant (P10A). b IFN-β promoter activity and ISRE reporter activity in IRF3−/− H1299 cells transfected with the Myc empty vector or the plasmid expressing wild-type IRF3 or its mutant (P10A). c qPCR analysis of IFN-β mRNA in HEK293T transfected with the empty vector or the plasmid expressing wild-type IRF3 (WT) or its mutant (P10A), followed by infected without (UI) or with SeV for 8 h. d qPCR analysis of IFN-β, CXCL10 and ISG15 mRNA in IRF3−/− H1299 transfected with the empty Flag vector or the plasmid expressing Flag-tagged wild-type IRF3 or its mutant (P10A), together with the empty Myc vector or the plasmid expressing Myc-tagged EGLN1 (EGLN1). e qPCR analysis of Ifn-β mRNA in Irf3 and Irf7-deficient MEF (Irf3−/−Irf7−/−) transfected with the empty Flag vector or the plasmid expressing Flag-tagged wild-type Irf3 or its mutant (P10A), together with the empty Myc vector or the plasmid expressing Myc-tagged Egln1 (Egln1). fIRF3−/− H1299 were transfected with the plasmid expressing Flag-tagged wild-type IRF3 or its mutant (P10A) for 24 h, followed by infection without or with VSV-GFP viruses for 12 h, and viral infectivity was detected by fluorescence microscopy or flow cytometry analysis (bottom panels). gIRF3−/− H1299 were transfected with the plasmid expressing HA-tagged wild-type IRF3 or P10A mutant (P10A), followed by infection without or with SeV for 8 h. Confocal microscopy image of exogenous IRF3 was detected by immunofluorescence staining with anti-HA antibody. Scale bar = 25 µm. BR, bright field. Data in (a, b) are presented as mean ± S.D., two-tailed Student’s t test; n = 3 biological independent experiments. Data in (ce) are presented as mean ± S.D., two-way ANOVA; n = 3 biological independent experiments. Data in (f, g) are representative from three independent experiments. See also Supplementary Fig. 13. Source data are provided as a Source data file.

Acknowledgments
This image is the copyrighted work of the attributed author or publisher, and ZFIN has permission only to display this image to its users. Additional permissions should be obtained from the applicable author or publisher of the image. Full text @ Nat. Commun.