IMAGE

Fig. 9

ID
ZDB-IMAGE-240429-55
Source
Figures for Liu et al., 2024
Image
Figure Caption

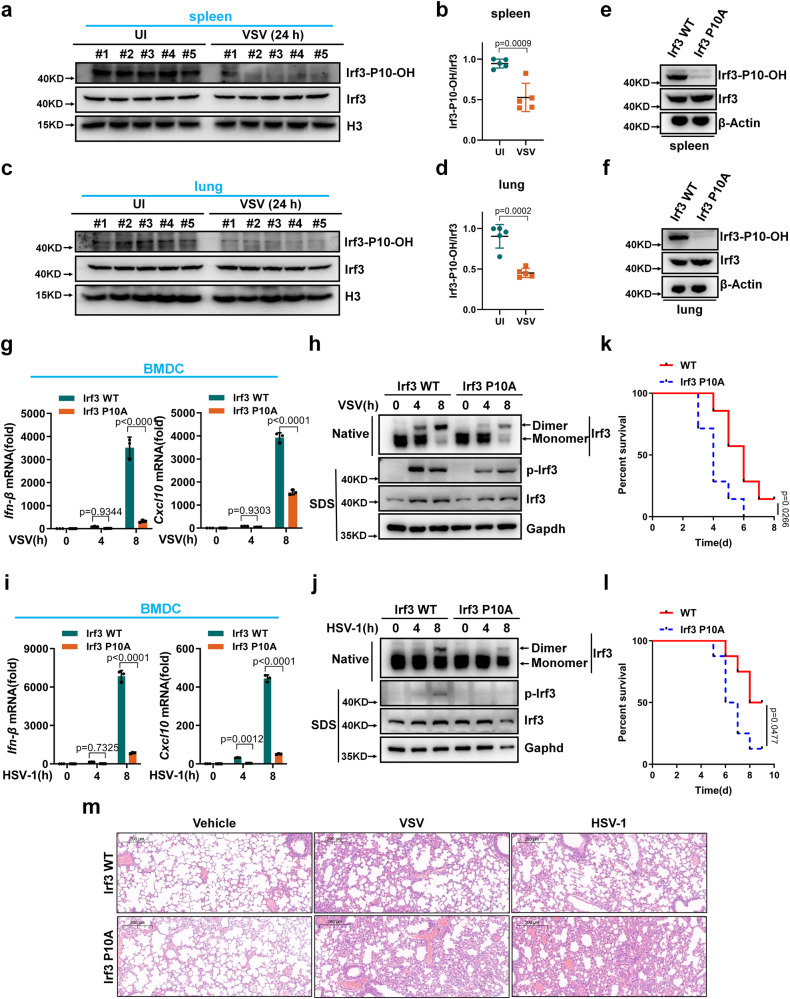
Fig. 9 Irf3 prolyl hydroxylation deficiency attenuates antiviral innate immunity in mice.

a Irf3 prolyl hydroxylation in spleen of wild-type mice infected without (UI) or with VSV for 24 h. b Quantitation of Irf3 prolyl hydroxylation in (a). c Irf3 prolyl hydroxylation in lung of WT mice infected without or with VSV for 24 h. d Quantitation of Irf3 prolyl hydroxylation in (c). e, f Proteins in spleen (e) and lung (f) of Irf3_P10A mutant and WT littermates (Irf3_P10A and Irf3-WT). g qPCR analysis of Ifn-β and Cxcl10 mRNA in WT or Irf3_P10A mutant BMDCs (Irf3-WT or Irf3_P10A) infected with VSV. h WT or Irf3_P10A mutant BMDCs (Irf3-WT or Irf3_P10A) were infected with VSV for the indicated times, and the cell lysates were analyzed by immunoblotting. i qPCR analysis of Ifn-β and Cxcl10 mRNA in WT or Irf3_P10A-mutant BMDCs (Irf3-WT or Irf3_P10A) infected with HSV-1. j WT or Irf3_P10A mutant BMDCs (Irf3-WT or Irf3_P10A) were infected with HSV-1 for the indicated times, and the cell lysates were analyzed by immunoblotting. k Survival (Kaplan-Meier curve) of WT mice and Irf3_P10A mutant mice injected intraperitoneally with a high dose of VSV (5 × 107 PFU per mouse). Statistical analysis was performed using the log-rank test (n = 7 for each group). l Survival of WT mice and Irf3_P10A mutant mice injected intraperitoneally with a high dose of HSV-1 (5 × 107 PFU per mouse). Statistical analysis was performed using the log-rank test (n = 8 for each group). m H & E stained images of lung sections from WT or Irf3_P10A mutant mice (Irf3-WT or Irf3_P10A) injected intraperitoneally with PBS (phosphate buffer saline), VSV (5 × 107 PFU per mouse) or HSV-1 (5 × 107 PFU per mouse) for 24 h. Data in (a, c, e, f, h, j, m) are representative from three independent experiments. Data in (b, d) are presented as mean ± S.D., two-tailed Student’s t test; n = 5 biological independent samples. Data in (g, i) are presented as mean ± S.D., two-way ANOVA; n = 3 biological independent experiments. See also Supplementary Figs. 1416. Source data are provided as a Source data file.

Acknowledgments
This image is the copyrighted work of the attributed author or publisher, and ZFIN has permission only to display this image to its users. Additional permissions should be obtained from the applicable author or publisher of the image. Full text @ Nat. Commun.