|
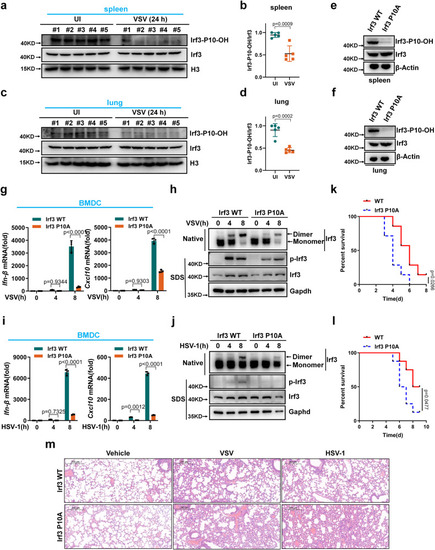
Irf3 prolyl hydroxylation deficiency attenuates antiviral innate immunity in mice. a Irf3 prolyl hydroxylation in spleen of wild-type mice infected without (UI) or with VSV for 24 h. b Quantitation of Irf3 prolyl hydroxylation in (a). c Irf3 prolyl hydroxylation in lung of WT mice infected without or with VSV for 24 h. d Quantitation of Irf3 prolyl hydroxylation in (c). e, f Proteins in spleen (e) and lung (f) of Irf3_P10A mutant and WT littermates (Irf3_P10A and Irf3-WT). g qPCR analysis of Ifn-β and Cxcl10 mRNA in WT or Irf3_P10A mutant BMDCs (Irf3-WT or Irf3_P10A) infected with VSV. h WT or Irf3_P10A mutant BMDCs (Irf3-WT or Irf3_P10A) were infected with VSV for the indicated times, and the cell lysates were analyzed by immunoblotting. i qPCR analysis of Ifn-β and Cxcl10 mRNA in WT or Irf3_P10A-mutant BMDCs (Irf3-WT or Irf3_P10A) infected with HSV-1. j WT or Irf3_P10A mutant BMDCs (Irf3-WT or Irf3_P10A) were infected with HSV-1 for the indicated times, and the cell lysates were analyzed by immunoblotting. k Survival (Kaplan-Meier curve) of WT mice and Irf3_P10A mutant mice injected intraperitoneally with a high dose of VSV (5 × 10⁷ PFU per mouse). Statistical analysis was performed using the log-rank test (n = 7 for each group). l Survival of WT mice and Irf3_P10A mutant mice injected intraperitoneally with a high dose of HSV-1 (5 × 10⁷ PFU per mouse). Statistical analysis was performed using the log-rank test (n = 8 for each group). m H & E stained images of lung sections from WT or Irf3_P10A mutant mice (Irf3-WT or Irf3_P10A) injected intraperitoneally with PBS (phosphate buffer saline), VSV (5 × 10⁷ PFU per mouse) or HSV-1 (5 × 10⁷ PFU per mouse) for 24 h. Data in (a, c, e, f, h, j, m) are representative from three independent experiments. Data in (b, d) are presented as mean ± S.D., two-tailed Student’s t test; n = 5 biological independent samples. Data in (g, i) are presented as mean ± S.D., two-way ANOVA; n = 3 biological independent experiments. See also Supplementary Figs. 14–16. Source data are provided as a Source data file.
|