
- Title
-
ERK-activated CK-2 triggers blastema formation during appendage regeneration
- Authors
- Zhang, X.S., Wei, L., Zhang, W., Zhang, F.X., Li, L., Li, L., Wen, Y., Zhang, J.H., Liu, S., Yuan, D., Liu, Y., Ren, C., Li, S.
- Source
- Full text @ Sci Adv
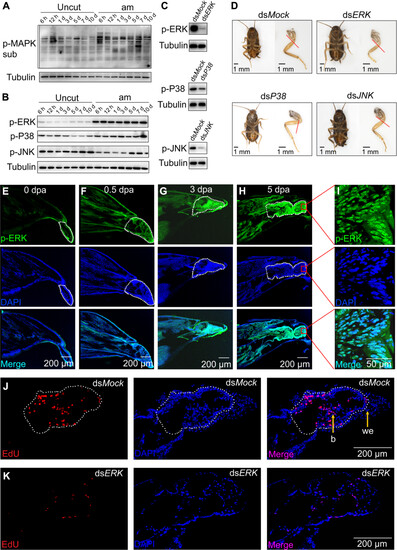
ERK was rapidly and sustained activated by phosphorylation to trigger blastema formation and leg regeneration. (A) Detection of MAPK pathway activity in the regenerating leg by Western blot. Uncut indicates uncut leg used as control; am indicates amputated leg; uncut and am also applies to the following legend. (B) Detection of p-ERK, p-P38, and p-JNK by Western blot. (C) In vivo double-stranded RNA (dsRNA) against ERK, P38, and JNK decreased the p-ERK, p-P38, and p-JNK levels, respectively. (D) ERK is required for leg regeneration. Injection of 1 μg of dsRNA against ERK, P38, and JNK and the regenerated legs were photographed. The red dashed line represents the amputation plane. Scale bars, 1 mm. (E to H) Immunofluorescence (IF) analysis of p-ERK in the regenerating leg after amputation. Nuclei were stained using DAPI (blue). The white dotted frame indicates the trochanter (0 dpa, 0.5 dpa) or the blastema (3 dpa, 5 dpa). Scale bar, 200 μm. (I) p-ERK was mainly localized in nuclei in the regenerating leg. Scale bar, 50 μm. (J and K) ERK is required for blastema formation during leg regeneration. Blastema formation was detected at 3 dpa by using 5-ethynyl-2-deoxyuridine (EdU) and 4′, 6-diamidino-2-phenylindole (DAPI) staining. The white dotted frame indicates the blastema. dsMock was used as a control. we, wound epidermis; b, blastema. Scale bars, 200 μm. |
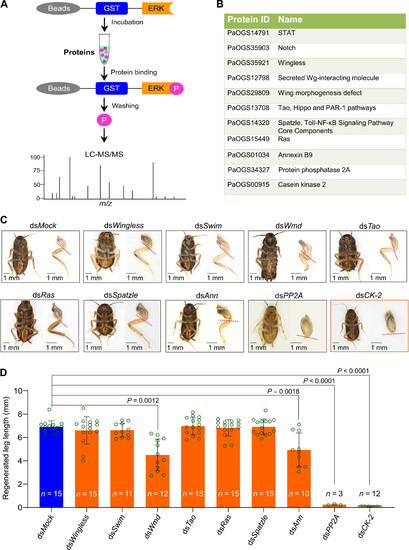
Screening of ERK-binding proteins required for leg regeneration. (A) Schematic of GST pull-down combined with LC-MS/MS for identifying ERK targets. The beads immobilized GST-ERKs were incubated with American cockroach leg extracts. After incubation and washing, the binding proteins were analyzed by liquid chromatography tandem mass spectrometry (LC-MS/MS) analysis. P indicates ERK-binding proteins. (B) List of ERK associated protein participated in embryonic development. (C) Screening the binding proteins of ERK from (B) for leg regeneration by in vivo RNAi. RNAi knockdown of CK-2 severely inhibits leg regeneration (red frame).The red dashed line represents the amputation plane. Scale bars, 1 mm. (D) Statistical analysis for the effect of the genes from (C) on the leg regeneration. The regenerated leg length was measured by using ImageJ. n represents the number of regenerated legs. Student’s t test. m/z, mass/charge ratio. |
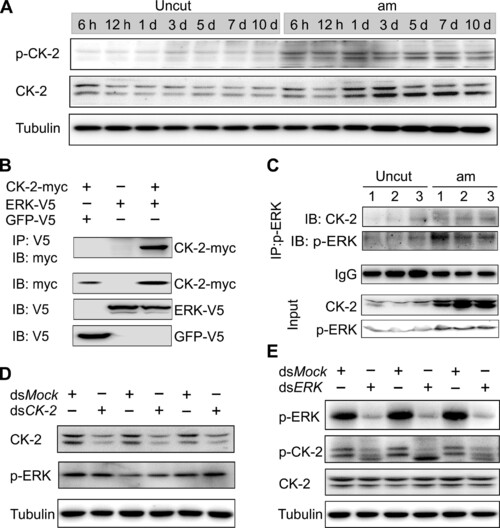
ERK phosphorylates and activates CK-2 to promote leg regeneration. (A) Patterns of p–CK-2 and CK-2 were up-regulated in the regenerating legs. (B) ERK combined with CK-2 by co-immunoprecipitation (co-IP). KC cells were cotransfected with the plasmids of ERK-V5 and CK-2–myc for 48 hours, and the cell extracts were immunoprecipitated (IP) with anti-V5 antibody, followed by immunoblot (IB) with anti-myc and anti-V5 antibody, respectively. (C) The combination between ERK and CK-2 was stronger in the regenerating legs than uncut group. The protein extracts (~1000 μg) of 3-dpa regenerating legs were immunoprecipitated with anti–p-ERK antibody, followed by IB with anti–CK-2 antibody or p-ERK antibody. Immunoglobulin G (IgG) indicated the antibody dose. (D) CK-2 has no effect on p-ERK. CK-2 dsRNA was injected for 48 hours. Protein levels of CK-2 and p-ERK were detected by Western blot using indicated antibody. Tubulin was used as loading control. Three biological replicates were performed. (E) ERK phosphorylates CK-2 in regenerating legs. ERK dsRNA was injected for 48 hours. Protein levels of p-ERK, p–CK-2, and CK-2 were detected by Western blot. Tubulin was used as loading control. Three biological replicates were performed. |
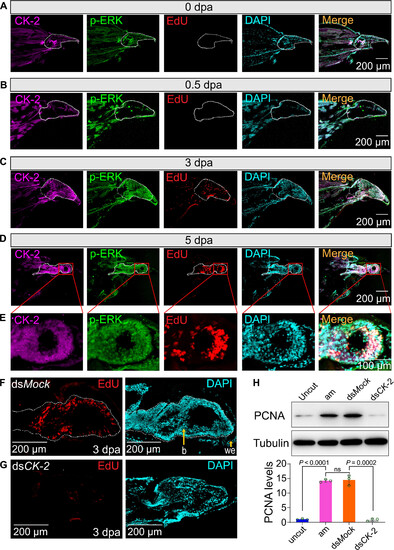
CK-2 promotes blastema formation by regulating cell proliferation. (A to D) Sections of regenerating legs stained with CK-2, p-ERK, and EdU at 0, 0.5, 3, and 5 dpa. The white dotted frame indicates the trochanter (0 dpa, 0.5 dpa) or the blastema (3 dpa, 5 dpa). Scale bars, 200 μm. (E) Micrograph was enlarged from (D) with 40×. Scale bar, 100 μm. (F and G) Detection of cell proliferation by EdU staining in response to CK-2 dsRNA injection. Nuclei were stained using DAPI (cyan). The white dotted frame indicates the blastema. Scale bars, 200 μm. (H) Detection of PCNA protein levels by Western blot. Uncut indicates uncut legs; am indicates 3-dpa regenerating legs; dsMock indicated 3-dpa regenerating legs were injected with Mock dsRNA, which was used as negative control. Each point represents the mean ± SD of three independent replicates. Student’s t test. |

CK-2 promotes cell proliferation by activating the expression of mitosis-related genes. (A) DNA replication process was down-regulated in response to CK-2 knockdown. RES, running enrichment score; RLM, ranked list metric. (B) Toll and Imd signaling pathway was up-regulated in response to CK-2 knockdown. RES, running enrichment score; RLM, ranked list metric. (C) Heatmap analysis demonstrated the differentially expressed genes in response to CK-2 knockdown. Colors represent the z scores of gene expression, where blue indicates low expression and red indicates high expression in response to CK-2 knockdown. The color bar depicts the range of z scores, with specific numerical values available in the color scale on the right. (D) Expression of mitosis-related genes from (C). Student’s t test. (E) Function of mitosis-related genes on leg regeneration. The dsRNA (1 μg) targeting the mitosis-related genes were injected separately, and the regenerated legs were photographed. The red dashed line represents the amputation plane. Scale bars, 1 mm. FPKM, fragments per kilobase of transcript per million fragments mapped. |

CK-2 drives blastema formation in zebrafish by promoting cell proliferation. (A) Regenerating fins at 3 and 15 dpa after dimethyl sulfoxide (DMSO) or CX-4945 (20 μM) treatment. The red frames indicate the regenerated area. Scale bars, 1 mm. (B and C) Quantification of fin regenerating tissue size from (A). Student’s t test. (D and E) Sections of regenerating fins stained with CK-2, p-ERK, and EdU at 0 and 3 dpa. The white dashed line indicates amputation plane. we, wound epidermis; be, basal epidermal layer; b, blastema; sm, stump mesenchyme. Scale bars, 50 μm. (F) Inhibition of CK-2 blocks the blastema formation by down-regulating the cell proliferation. EdU staining (red) and PCNA antibody staining (green) were used to examine cell proliferation. Nuclei were stained using DAPI (white). The white dashed line indicates amputation plane. Scale bars, 50 μm. |
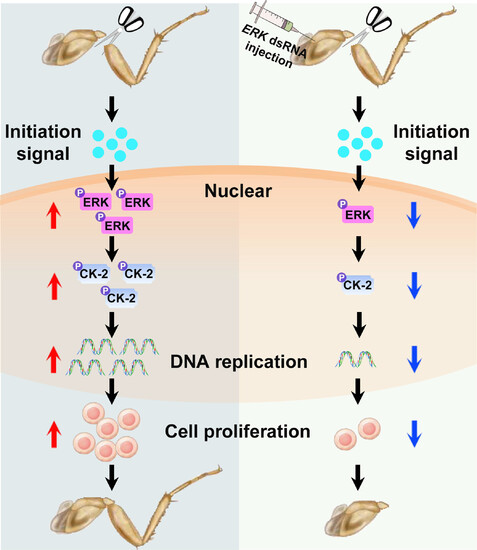
Schematic diagram of ERK-activated CK-2 drives leg regeneration by regulating cell proliferation. When the leg of P. americana was amputated, the regenerative initiation signals will active ERK by up-regulating the phosphorylation levels. Activated ERK rapidly and continuously phosphorylates and activates CK-2 within blastema cell nuclear. Following activation, CK-2 can up-regulate DNA replication to promote cell proliferation and then the blastema formation to regeneration. However, down-regulation of ERK levels resulted in defected activation of CK-2 and failed leg regeneration. |