
|
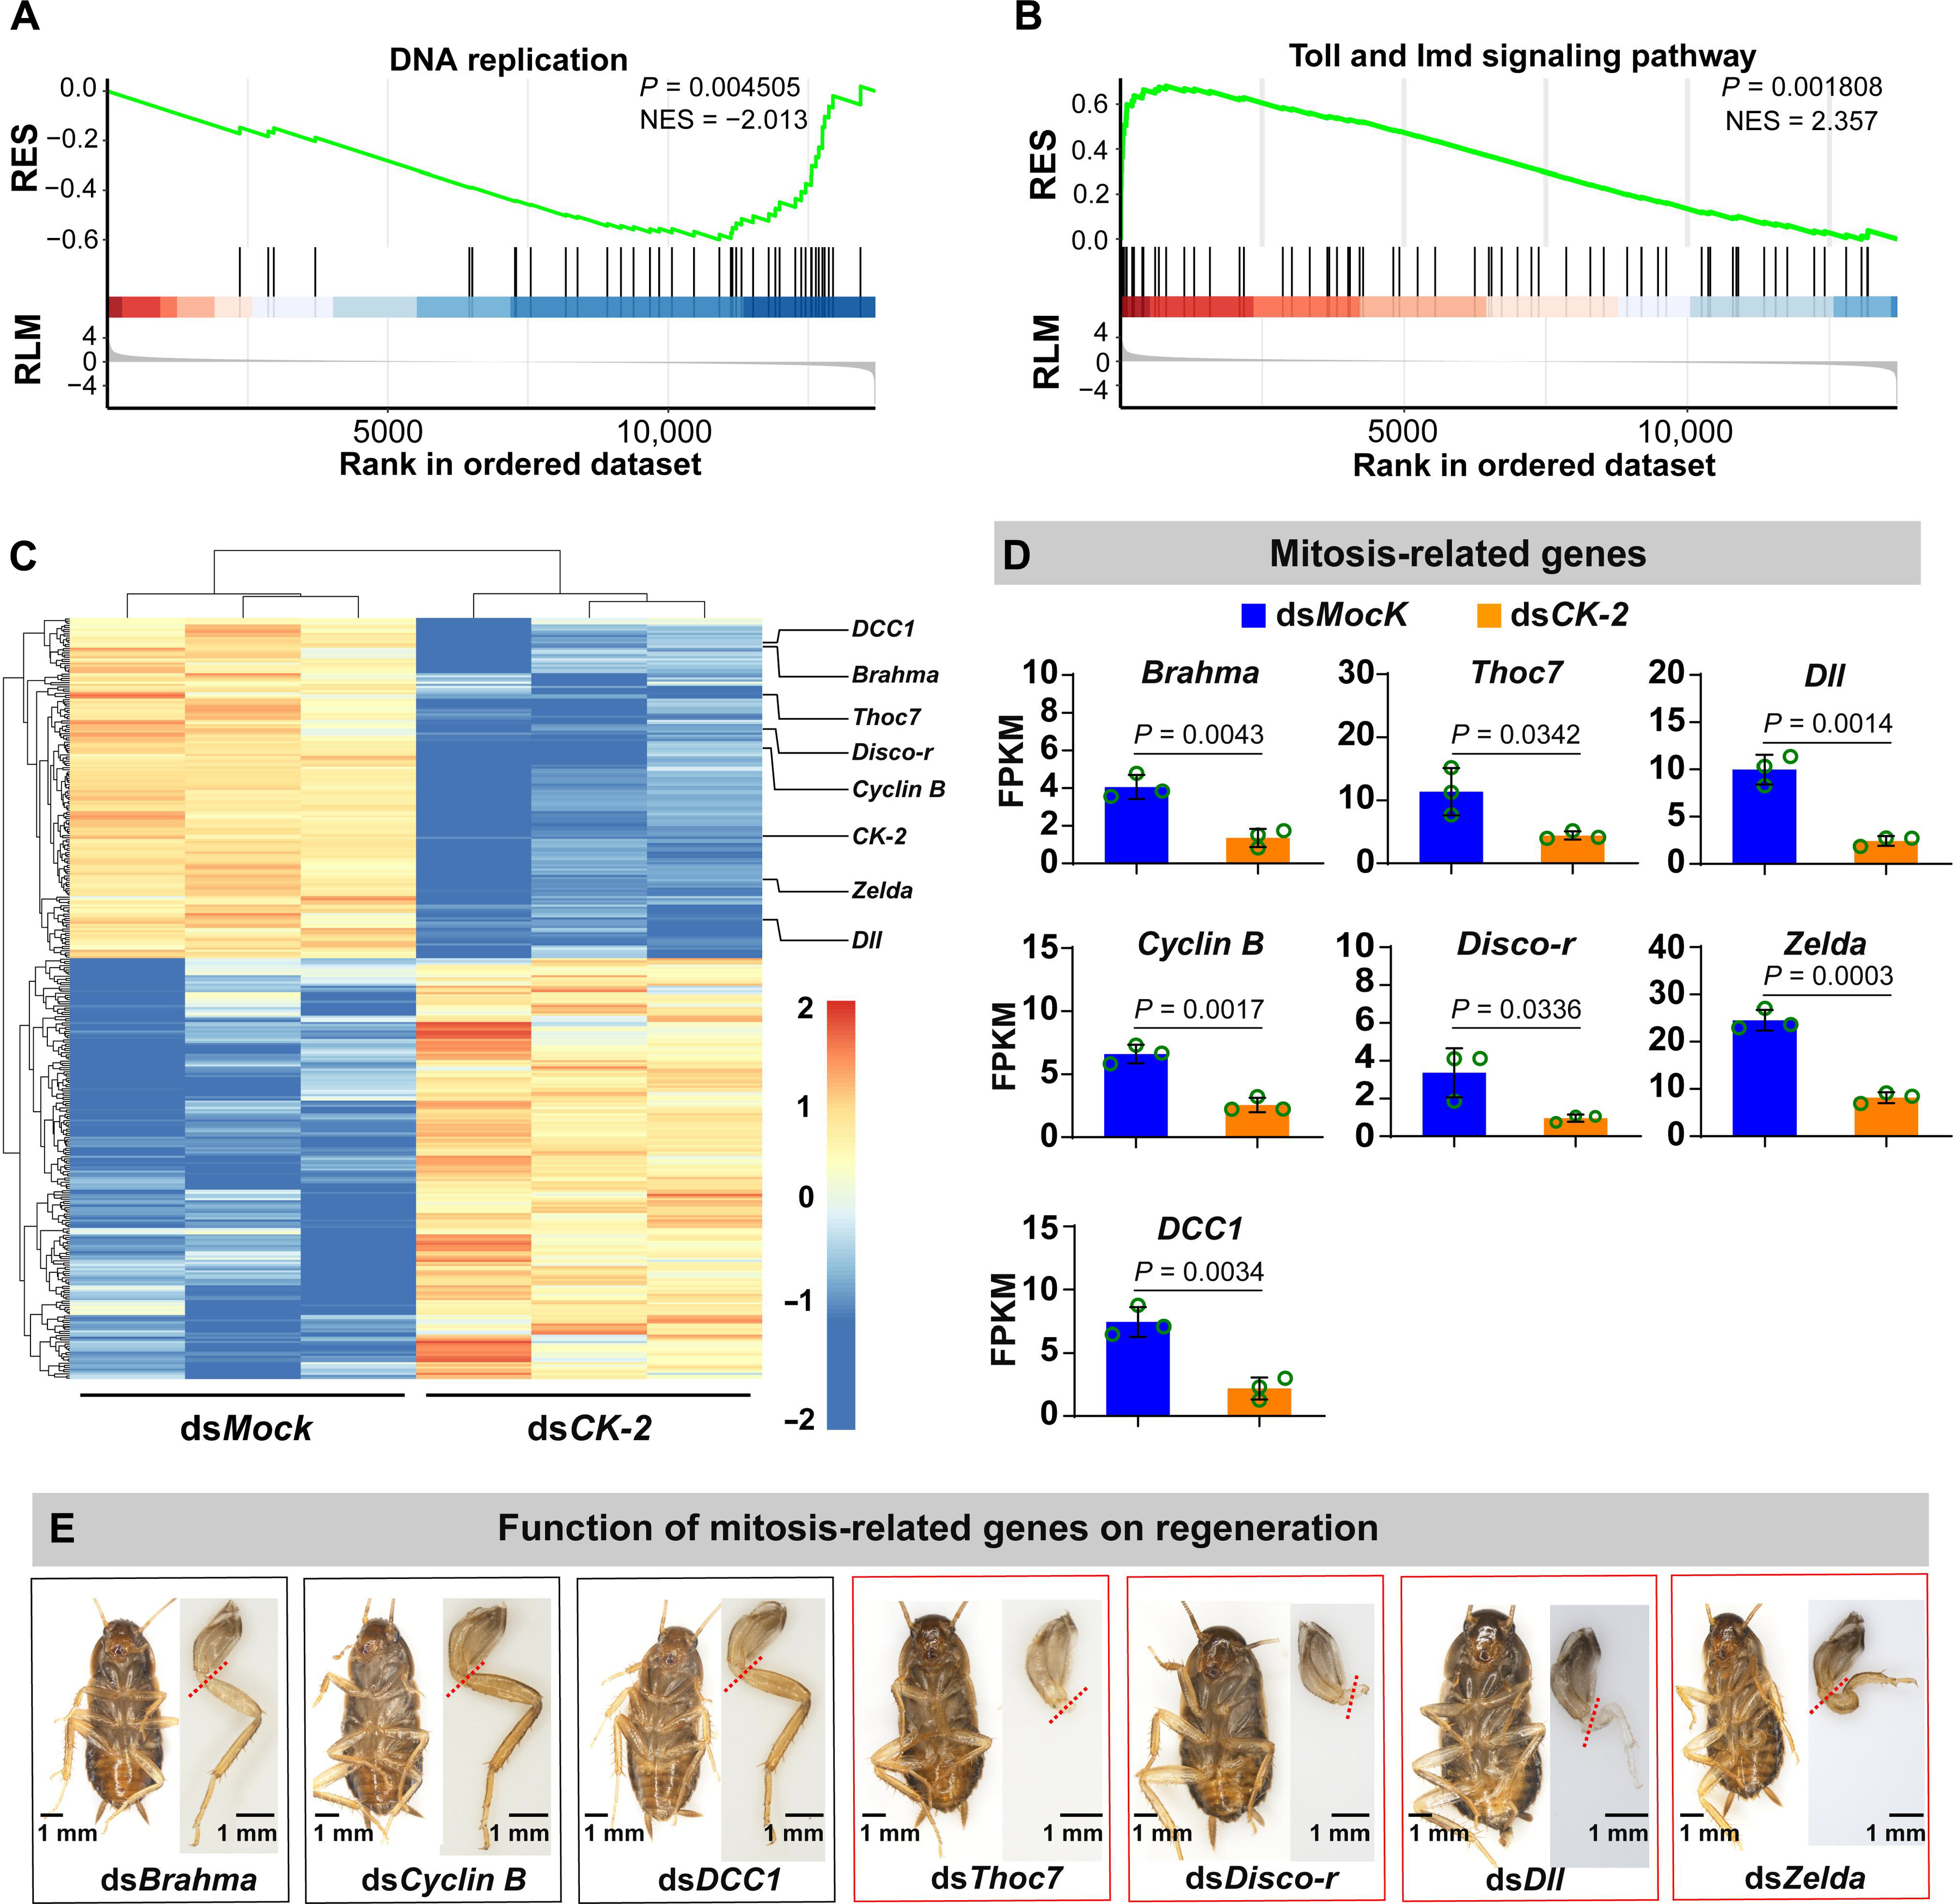
Fig. 5 CK-2 promotes cell proliferation by activating the expression of mitosis-related genes. (A) DNA replication process was down-regulated in response to CK-2 knockdown. RES, running enrichment score; RLM, ranked list metric. (B) Toll and Imd signaling pathway was up-regulated in response to CK-2 knockdown. RES, running enrichment score; RLM, ranked list metric. (C) Heatmap analysis demonstrated the differentially expressed genes in response to CK-2 knockdown. Colors represent the z scores of gene expression, where blue indicates low expression and red indicates high expression in response to CK-2 knockdown. The color bar depicts the range of z scores, with specific numerical values available in the color scale on the right. (D) Expression of mitosis-related genes from (C). Student’s t test. (E) Function of mitosis-related genes on leg regeneration. The dsRNA (1 μg) targeting the mitosis-related genes were injected separately, and the regenerated legs were photographed. The red dashed line represents the amputation plane. Scale bars, 1 mm. FPKM, fragments per kilobase of transcript per million fragments mapped.