FIGURE SUMMARY
Title

Foxp- and Skor-family proteins control differentiation of Purkinje cells from Ptf1a and Neurogenin1-expressing progenitors in zebrafish

Authors
Itoh, T., Uehara, M., Yura, S., Wang, J.C., Fujii, Y., Nakanishi, A., Shimizu, T., Hibi, M.
Source
Full text @ Development

Expression of ptf1a and neurog1 in the cerebellum. (A) Schematic of cerebellar neurogenesis. Development of cerebellar neurons from neural progenitors in the VZ and URL. TFs, transcription factors. (B-E) Expression of ptf1a (B,C) and neurog1 (D,E) mRNA at 3 dpf, detected by in situ hybridization. Dorsal (B,D) and lateral views (C,E) with anterior to the left. Expression of ptf1a in the cerebellar ventricular zone is marked by arrowheads. Expression of neurog1, marked by asterisks, was observed in the tectum but not the cerebellum. (F-H) Detection of ptf1a- and/or neurog1-expressing cells using transgenic lines. 5-dpf Tg(ptf1a:GAL4-VP16); Tg(UAS:RFP); Tg(neurog1:GFP) larvae (n=3) were stained with anti-RFP (magenta) and anti-GFP (green) antibodies. Tg(ptf1a:GAL4-VP16); Tg(UAS:RFP) is referred to as ptf1a::RFP. Dorsal views of the rostral hindbrain region, including the cerebellum. The cerebellar region (Ce) is surrounded by a dashed line. (I-K) Higher magnification views of the boxed areas in E-G. ptf1a::RFP and neurog1:GFP double-positive cells are marked by white arrows (I) and the expression of neurog1:GFP+ cells in the cerebellar ventricular zone is indicated by white asterisks (K). Scale bars: 100 μm (in B, for B-E); 50 μm (in F, for F-H); 20 μm (in I, for I-K).

ptf1a and neurog1 are required for the development of GABAergic PCs and INs. (A-AF) Expression of parvalbumin 7 (Pvalb7, A-D), Pax2 (E-H), foxp1b (I-L), foxp4 (M-P), skor1b (Q-T), skor2 (U-X), lhx1a (Y-AB) and rorb (AC-AF) in the cerebellum of 5 dpf WT, neurog1 mutant, ptf1a mutant and ptf1a;neurog1 double-mutant larvae, revealed by immunostaining with anti-Pvalb7 (A-D) and anti-Pax2 (E-H) antibodies, or by in situ hybridization (I-AF). Dorsal views with anterior to the left. The cerebellum region (Ce) is surrounded by a dotted line (E-H). Pvalb7, foxp1b/4, skor1b/2, lhx1a, and rorb were expressed in PCs (expression of PC genes in the cerebellum is indicated by arrowheads). Pax2 is a marker of GABAergic INs. The number of examined larvae and larvae showing each expression pattern is given in Table 1. Scale bars: 50 μm (in A, for A-H); 100 μm (in I, for I-AF). (AG,AH) Number of Pvalb7+ PCs and Pax2+ INs in the cerebellum of 5 dpf WT, neurog1, ptf1a and ptf1a;neurog1 mutant larvae. **P<0.01, ***P<0.001, ****P<0.0001 (ANOVA with Tukey's multiple comparison test). Data are shown as mean±s.e.m. with individual values indicated. n=3 for each genotype.

ptf1a and neurog1 are involved in the development of ECs and GCs. (A-T) Expression of olig2 (A-D), vglut2a (E-H), atoh1a (I-L), atoh1b (M-P) and atoh1c (Q-T) in 5 dpf WT, neurog1, ptf1a and ptf1a;neurog1 mutant larvae, revealed by in situ hybridization. olig2 and vglut2a were expressed in ECs. atoh1a/b/c were expressed in GC progenitors. Arrowheads indicate the expression in the cerebellum. The expression area of vglut2a is surrounded by a dotted line (E-H). (U-AB) Expression of the GC markers Neurod1 and Vglut1 in 5 dpf WT, neurog1, ptf1a and ptf1a;neurog1 mutant larvae, revealed by immunostaining. The expression pattern of Neurod1 and Vglut1 was affected in ptf1a and ptf1a;neurog1 mutants, but the area of Neurod1-expression domains was variable in ptf1a mutants. The number of examined larvae and larvae showing each expression pattern is given in Table 1. Scale bars: 100 μm (in A, for A-T); 50 μm (in U, for U-AB).

GABAergic PCs and INs are derived from Ptf1a-expressing neural progenitors. (A-F) Expression of Pvalb7 and GFP in 5 dpf TgBAC(gad1b:LOXP-DsRed-LOXP-GFP) larvae that were treated with DMSO (control, n=5; A-C) or endoxifen (n=5; D-F) at 2 dpf. (G-R) Expression of Pvalb7 and GFP in 5 dpf TgBAC(ptf1a:Gal4-VP16); Tg(UAS-hsp70l:mCherry-T2A-CreERT2); TgBAC(gad1b:LOXP-DsRed-LOXP-GFP) larvae that were treated with DMSO (n=5; G-L) or endoxifen (n=5; M-R) at 2 dpf. The larvae were stained with anti-Pvalb7 (cyan), anti-RFP (magenta) and anti-GFP (green) antibodies. Dorsal views with anterior to the left. The cerebellum region (Ce) is surrounded by a dotted line. (J-L,P-R) Higher magnification views of the boxed areas in G-I,M-O. Arrows and arrowheads indicate Pvalb7+ GFP+ cells (PCs) and Pvalb7 GFP+ cells (INs), respectively. Scale bars: 50 μm (in A, for A-F; in G, for G-I,M-O); 10 μm (in J, for J-L,P-R). (S-U) Total number of GFP+ cells (S), Pvalb7+ GFP+ cells (T) and Pvalb7 GFP+ cells (U) in the cerebellum of larvae treated with DMSO or endoxifen. *P<0.05, ***P<0.001, ****P<0.0001 (two-way ANOVA followed by Bonferroni multiple comparisons). Data are shown as mean±s.e.m. with individual values indicated.

Some GCs are also derived from Ptf1a-expressing neural progenitors. (A-F) Expression of TagCFP (cyan) and Kaede (green) in 5 dpf Tg(cbln12:LOXP-TagCFP-LOXP-Kaede) larvae that were treated with DMSO (control, n=5; A-C) or endoxifen (n=5; D-F) at 2 dpf. (G-R) Expression of TagCFP and Kaede in 5 dpf TgBAC(atoh1c:Gal4FF); Tg(UAS-hsp70l:RFP-T2A-CreERT2); Tg(cbln12:LOXP-TagCFP-LOXP-Kaede) larvae that were treated with DMSO (n=6; G-J) or endoxifen (n=5; K-R) at 2 dpf. The larvae were stained with anti-TagCFP (cyan), anti-RFP (magenta) and anti-Kaede (green) antibodies. Dorsal views with anterior to the left. The cerebellum region (Ce) is surrounded by a dotted line. (O-R) Higher magnification views of the boxed areas in K-N. Arrows indicate parallel fibers of GCs. Scale bars: 50 μm (in A, for A-F; in G, for G-N; in O, for O-R). (S) Number of Kaede+ cells in the cerebellum of larvae treated with DMSO or endoxifen. ***P<0.001 (two-way ANOVA followed by Bonferroni multiple comparisons). Data are shown as mean±s.e.m. with individual values indicated.

Foxp1b, Skor1b and Skor2 are expressed in differentiating and differentiated PCs. (A-R) Localization of Foxp1b. 5 dpf WT (n=3; A-F) and foxp1b mutant (n=3; G-L) larvae, and adult WT (n=2: M-O) and foxp1b mutant (n=2; P-R) cerebellum sections immunostained with anti-Foxp1b (magenta) and anti-Pvalb7 antibodies (green). Dorsal views with anterior to the left (A-L) and sagittal sections (M-R). (D-F,J-L) Higher magnification views of the boxed areas in A-C,G-I. Arrowheads and arrows indicate examples of Foxp1b+ Pvalb7+ cells and Foxp1b+ Pvalb7 cells, respectively (D-F,M-O). (S-AP) Localization of Skor1b and Skor2. (S-AD) 5 dpf WT (n=3; S-X) and skor1b mutant larvae (n=3; Y-AD) immunostained with anti-Skor1b (magenta) and anti-Pvalb7 antibodies (green). (AE-AP) 5 dpf WT (n=2; AE-AJ) and skor2 mutant larvae (n=2; AK-AP) immunostained with anti-Skor2 (magenta) and anti-Pvalb7 antibodies (green). Dorsal views with anterior to the left. (V-X,AB-AD,AH-AJ,AN-AP) Higher magnification views of the boxed areas in S-U,Y-AA,AE-AG,AK-AM. Scale bars: 50 μm (in A, for A-C,G-I; in D, for D-F,J-L; in M, for M-R; in S, for S-U,Y-AA; in V, for V-X,AB-AD; in AE, for AE-AG,AK-AM; in AH, for AH-AJ,AN-AP). Arrowheads indicate examples of Skor1b+ Pvalb7+ cells (V-X) and Skor2+ Pvalb7+ cells (AH-AJ). Arrows indicate examples of Skor1b+ Pvalb7 cells (V-X) and Skor2+ Pvalb7 cells (AH-AJ).

Phenotypes of foxp1b and foxp4 mutants. (A-T) Expression of the PC markers Pvalb7, Zebrin II and Ca8, and the GC markers Neurod1 and Vglut1 in 5 dpf WT, foxp1b, foxp4 and foxp1b;foxp4 mutant larvae, revealed by immunostaining. The cerebellum region (Ce) is surrounded by a dotted line. (U-AN) Expression of rorb, skor1b, skor2 and ptf1a in 5 dpf WT, foxp1b, foxp4 and foxp1b;foxp4 mutant larvae (U-AF,AK-AN) and expression of ptf1a in 3 dpf WT, foxp1b, foxp4 and foxp1b;foxp4 mutant larvae (AG-AJ), revealed by in situ hybridization. Dorsal views with anterior to the left. Arrowheads indicate expression of genes in the cerebellum. The number of examined larvae and larvae showing each expression pattern is shown in Table 2. Scale bars: 50 μm (in A, for A-T); 100 μm (in U, for U-AN). (AO) Number of Pvalb7+ PCs in the cerebellum of 5 dpf WT, foxp1b, foxp4 and foxp1b;foxp4 mutant larvae. ***P<0.001, ****P<0.0001 (ANOVA with Tukey's multiple comparison test). Data are shown as mean±s.e.m. with individual values indicated.

Phenotypes of skor1b and skor2 mutants. (A-P) Expression of the PC markers Pvalb7, Zebrin II and Ca8, and the GC marker Vglut1 in 5 dpf WT, skor1b, skor2 and skor1b;skor2 mutant larvae, revealed by immunostaining. The cerebellum region (Ce) is surrounded by a dotted line. (Q-AJ) Expression of rorb, foxp1b, foxp4 and ptf1a in 5 dpf WT, skor1b, skor2 and skor1b;skor2 mutant larvae (Q-AB,AG-AJ) and expression of ptf1a in 3(Q-AB,AG-AJ) dpf WT, skor1b, skor2, and skor1b;skor2 mutant larvae (AC-AF), revealed by in situ hybridization. Dorsal views with anterior to the left. Arrowheads indicate expression of genes in the cerebellum. Arrows indicate expression of foxp1b and foxp4 in caudal and rostral parts of the cerebellum (X,AB). The number of examined larvae and larvae showing each expression pattern is shown in Table 3. Scale bars: 50 μm (in A, for A-P); 100 μm (in Q, for Q-AJ). (AK) Number of Pvalb7+ PCs in the cerebellum of 5 dpf WT, skor1b, skor2 and skor1b;skor2 mutant larvae. ****P<0.0001 (ANOVA with Tukey's multiple comparison test). Data are shown as mean±s.e.m. with individual values indicated.

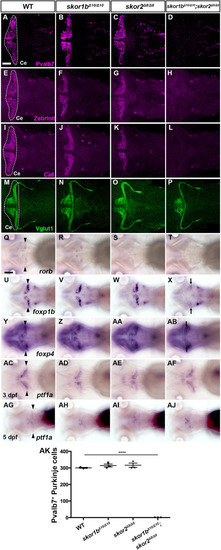
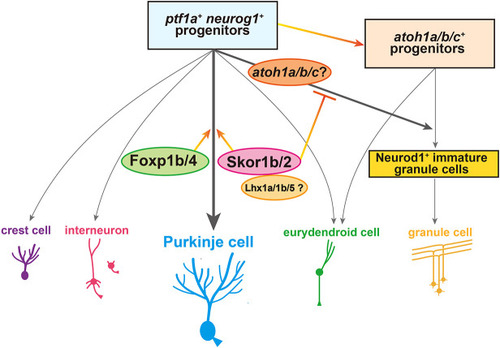
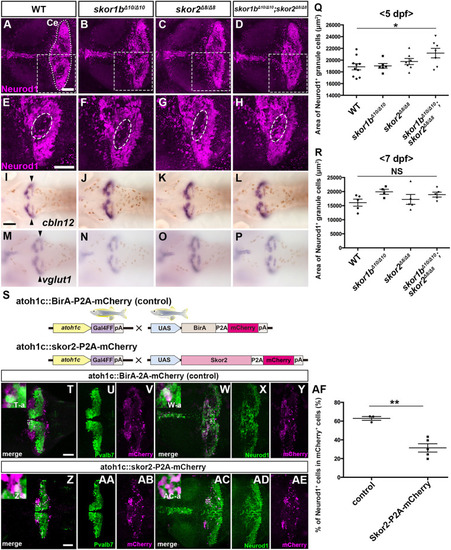
Suppression of granule cell fates by Skor1b/2 and Foxp1b/4. (A-H) Expression of Neurod1 in 5 dpf WT, skor1b, skor2 and skor1b;skor2 mutant larvae, revealed by immunostaining. The cerebellum region is surrounded by a dotted line. (E-H) Higher magnification views of the boxed areas in A-D. Neurod1-expressing GCs were absent in the central areas of the cerebellum (marked by dashed circles) of WT, skor1b and skor2 mutant larvae, but present in the entire cerebellum of skor1b;skor2 mutant larvae. (I-P) Expression of the mature GC marker genes cbln12 and vglut1 in the cerebellum, revealed by in situ hybridization. (Q,R) Area of Neurod1+ GCs in the cerebellum of 5 dpf (Q) or 7 dpf (R) WT, skor1b, skor2 and skor1b;skor2 mutants. *P<0.05 (ANOVA with Tukey's multiple comparison test). (S) Diagram of ectopic expression of biotin ligase A (BirA, control) or Skor2 in GC progenitors. (T-AE) Misexpression of Skor2 in atoh1c-expressing neural progenitors. 5 dpf Tg(atoh1c:Gal4FF);Tg(UAS-hsp70l:BirA-P2A-mCherry) or Tg(atoh1c:Gal4FF);Tg(UAS:HA-skor2-P2A-mCherry) larvae, which express BirA/mCherry or Skor2/mCherry in the GC lineage, were immunostained with anti-RFP/mCherry (magenta), and Pvalb7 (green; T-V,Z-AB) or Neurod1 (green; W-Y,AC-AE) antibodies. Dorsal views with anterior to the left (A-P,T-AE). Insets (T-a,W-a,Z-a,AC-a) show higher magnification views of the boxed areas in T,W,Z,AC. Scale bars: 50 μm (in A, for A-D; in E, for E-H; in T, for T-Y; in Z for Z-AE); 100 μm (in I, for I-P). (AF) Percentage of Neurod1+ cells out of total mCherry+ cells in the cerebellum of larvae expressing BirA (control) or Skor2. **P<0.01 (unpaired two-tailed Student's t-test). Data are shown as mean±s.e.m. with individual values indicated (Q,R,AF).

Schematic of a model for neuronal differentiation from Ptf1a/Neurog1-expressing neural progenitors. The roles of the transcriptional regulators involved in the specification and differentiation of Purkinje cells from neural progenitors expressing Ptf1a and Neurog1 are described. See Discussion section for more details.

Acknowledgments
This image is the copyrighted work of the attributed author or publisher, and ZFIN has permission only to display this image to its users. Additional permissions should be obtained from the applicable author or publisher of the image. Full text @ Development