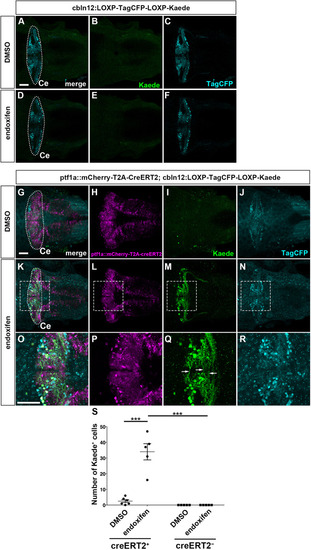
Some GCs are also derived from Ptf1a-expressing neural progenitors. (A-F) Expression of TagCFP (cyan) and Kaede (green) in 5 dpf Tg(cbln12:LOXP-TagCFP-LOXP-Kaede) larvae that were treated with DMSO (control, n=5; A-C) or endoxifen (n=5; D-F) at 2 dpf. (G-R) Expression of TagCFP and Kaede in 5 dpf TgBAC(atoh1c:Gal4FF); Tg(UAS-hsp70l:RFP-T2A-CreERT2); Tg(cbln12:LOXP-TagCFP-LOXP-Kaede) larvae that were treated with DMSO (n=6; G-J) or endoxifen (n=5; K-R) at 2 dpf. The larvae were stained with anti-TagCFP (cyan), anti-RFP (magenta) and anti-Kaede (green) antibodies. Dorsal views with anterior to the left. The cerebellum region (Ce) is surrounded by a dotted line. (O-R) Higher magnification views of the boxed areas in K-N. Arrows indicate parallel fibers of GCs. Scale bars: 50 μm (in A, for A-F; in G, for G-N; in O, for O-R). (S) Number of Kaede+ cells in the cerebellum of larvae treated with DMSO or endoxifen. ***P<0.001 (two-way ANOVA followed by Bonferroni multiple comparisons). Data are shown as mean±s.e.m. with individual values indicated.
|
