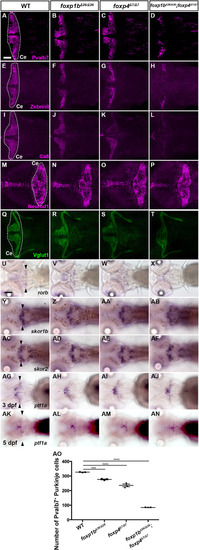
Phenotypes of foxp1b and foxp4 mutants. (A-T) Expression of the PC markers Pvalb7, Zebrin II and Ca8, and the GC markers Neurod1 and Vglut1 in 5 dpf WT, foxp1b, foxp4 and foxp1b;foxp4 mutant larvae, revealed by immunostaining. The cerebellum region (Ce) is surrounded by a dotted line. (U-AN) Expression of rorb, skor1b, skor2 and ptf1a in 5 dpf WT, foxp1b, foxp4 and foxp1b;foxp4 mutant larvae (U-AF,AK-AN) and expression of ptf1a in 3 dpf WT, foxp1b, foxp4 and foxp1b;foxp4 mutant larvae (AG-AJ), revealed by in situ hybridization. Dorsal views with anterior to the left. Arrowheads indicate expression of genes in the cerebellum. The number of examined larvae and larvae showing each expression pattern is shown in Table 2. Scale bars: 50 μm (in A, for A-T); 100 μm (in U, for U-AN). (AO) Number of Pvalb7+ PCs in the cerebellum of 5 dpf WT, foxp1b, foxp4 and foxp1b;foxp4 mutant larvae. ***P<0.001, ****P<0.0001 (ANOVA with Tukey's multiple comparison test). Data are shown as mean±s.e.m. with individual values indicated.
|
