
Fig. 1.
- ID
- ZDB-IMAGE-240501-25
- Publication
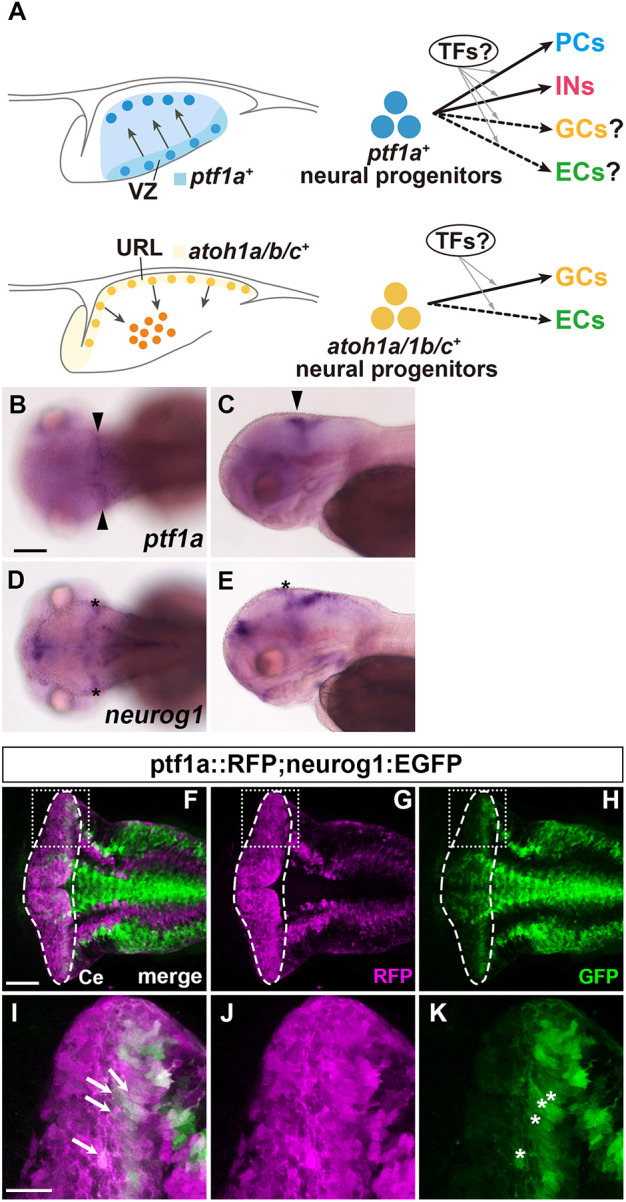
- Itoh et al., 2024 - Foxp- and Skor-family proteins control differentiation of Purkinje cells from Ptf1a and Neurogenin1-expressing progenitors in zebrafish
- All Figures
- Figures for Itoh et al., 2024
|
Fig. 1.