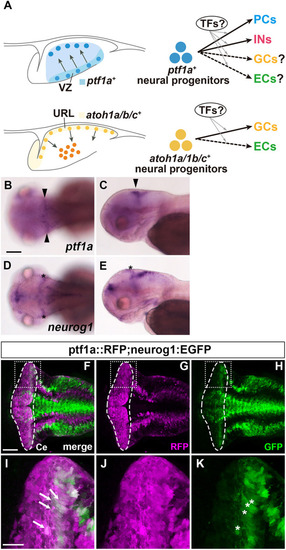
Expression of ptf1a and neurog1 in the cerebellum. (A) Schematic of cerebellar neurogenesis. Development of cerebellar neurons from neural progenitors in the VZ and URL. TFs, transcription factors. (B-E) Expression of ptf1a (B,C) and neurog1 (D,E) mRNA at 3 dpf, detected by in situ hybridization. Dorsal (B,D) and lateral views (C,E) with anterior to the left. Expression of ptf1a in the cerebellar ventricular zone is marked by arrowheads. Expression of neurog1, marked by asterisks, was observed in the tectum but not the cerebellum. (F-H) Detection of ptf1a- and/or neurog1-expressing cells using transgenic lines. 5-dpf Tg(ptf1a:GAL4-VP16); Tg(UAS:RFP); Tg(neurog1:GFP) larvae (n=3) were stained with anti-RFP (magenta) and anti-GFP (green) antibodies. Tg(ptf1a:GAL4-VP16); Tg(UAS:RFP) is referred to as ptf1a::RFP. Dorsal views of the rostral hindbrain region, including the cerebellum. The cerebellar region (Ce) is surrounded by a dashed line. (I-K) Higher magnification views of the boxed areas in E-G. ptf1a::RFP and neurog1:GFP double-positive cells are marked by white arrows (I) and the expression of neurog1:GFP+ cells in the cerebellar ventricular zone is indicated by white asterisks (K). Scale bars: 100 μm (in B, for B-E); 50 μm (in F, for F-H); 20 μm (in I, for I-K).
|
