|
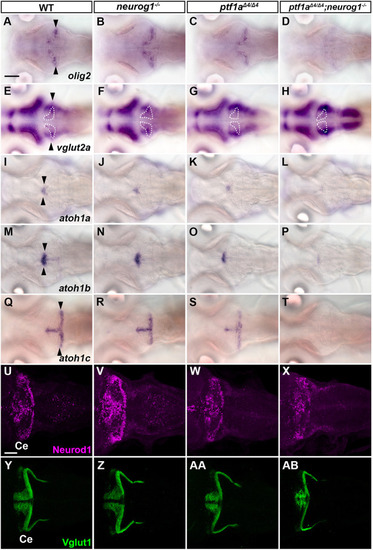
ptf1a and neurog1 are involved in the development of ECs and GCs. (A-T) Expression of olig2 (A-D), vglut2a (E-H), atoh1a (I-L), atoh1b (M-P) and atoh1c (Q-T) in 5 dpf WT, neurog1, ptf1a and ptf1a;neurog1 mutant larvae, revealed by in situ hybridization. olig2 and vglut2a were expressed in ECs. atoh1a/b/c were expressed in GC progenitors. Arrowheads indicate the expression in the cerebellum. The expression area of vglut2a is surrounded by a dotted line (E-H). (U-AB) Expression of the GC markers Neurod1 and Vglut1 in 5 dpf WT, neurog1, ptf1a and ptf1a;neurog1 mutant larvae, revealed by immunostaining. The expression pattern of Neurod1 and Vglut1 was affected in ptf1a and ptf1a;neurog1 mutants, but the area of Neurod1-expression domains was variable in ptf1a mutants. The number of examined larvae and larvae showing each expression pattern is given in Table 1. Scale bars: 100 μm (in A, for A-T); 50 μm (in U, for U-AB).
|