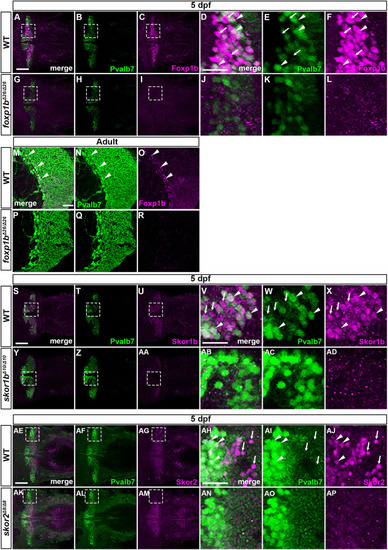
Foxp1b, Skor1b and Skor2 are expressed in differentiating and differentiated PCs. (A-R) Localization of Foxp1b. 5 dpf WT (n=3; A-F) and foxp1b mutant (n=3; G-L) larvae, and adult WT (n=2: M-O) and foxp1b mutant (n=2; P-R) cerebellum sections immunostained with anti-Foxp1b (magenta) and anti-Pvalb7 antibodies (green). Dorsal views with anterior to the left (A-L) and sagittal sections (M-R). (D-F,J-L) Higher magnification views of the boxed areas in A-C,G-I. Arrowheads and arrows indicate examples of Foxp1b+ Pvalb7+ cells and Foxp1b+ Pvalb7− cells, respectively (D-F,M-O). (S-AP) Localization of Skor1b and Skor2. (S-AD) 5 dpf WT (n=3; S-X) and skor1b mutant larvae (n=3; Y-AD) immunostained with anti-Skor1b (magenta) and anti-Pvalb7 antibodies (green). (AE-AP) 5 dpf WT (n=2; AE-AJ) and skor2 mutant larvae (n=2; AK-AP) immunostained with anti-Skor2 (magenta) and anti-Pvalb7 antibodies (green). Dorsal views with anterior to the left. (V-X,AB-AD,AH-AJ,AN-AP) Higher magnification views of the boxed areas in S-U,Y-AA,AE-AG,AK-AM. Scale bars: 50 μm (in A, for A-C,G-I; in D, for D-F,J-L; in M, for M-R; in S, for S-U,Y-AA; in V, for V-X,AB-AD; in AE, for AE-AG,AK-AM; in AH, for AH-AJ,AN-AP). Arrowheads indicate examples of Skor1b+ Pvalb7+ cells (V-X) and Skor2+ Pvalb7+ cells (AH-AJ). Arrows indicate examples of Skor1b+ Pvalb7− cells (V-X) and Skor2+ Pvalb7− cells (AH-AJ).
|
