
- Title
-
Somatic loss-of-function PIK3R1 and activating non-hotspot PIK3CA mutations associated with Capillary Malformation with Dilated Veins (CMDV)
- Authors
- De Bortoli, M., Queisser, A., Pham, V.C., Dompmartin, A., Helaers, R., Boutry, S., Claus, C., De Roo, A.K., Hammer, F., Brouillard, P., Abdelilah-Seyfried, S., Boon, L.M., Vikkula, M.
- Source
- Full text @ J. Invest. Dermatol.
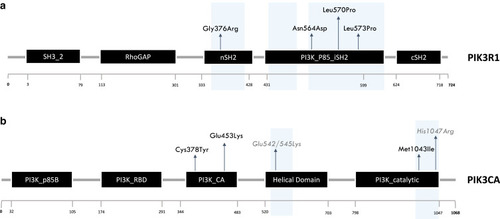
PIK3CA and PIK3R1 protein structures and distribution of identified variants. (a) PIK3R1 protein (p85) and its functional domains. Variants localized in the nSH2 domain (n = 1) and in the PI3K_P85_iSH2 domain (n = 3). L570P and L573P variants are predicted to be pathogenic but lack experimental validation. (b) PIK3CA (p110) and its functional domains. Variants reported in black localized in the Ca2+-binding domain (n = 2) and in PI3K catalytic domain (n = 1). Hotspot PIK3CA mutations are in grey. Cancer hotspot regions are highlighted in light blue. Ca2+, calcium ion; PI3K, phosphoinositide 3-kinase. |
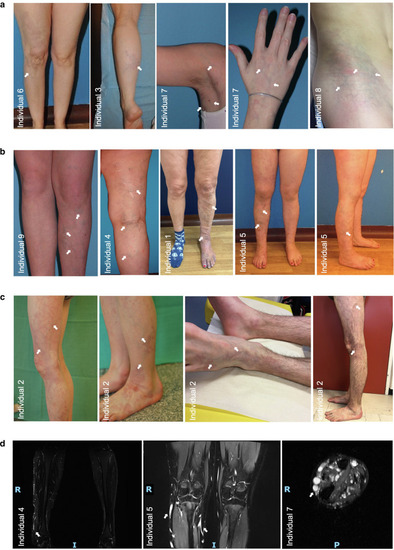
Clinical phenotype of patients with CMDV with PIK3R1 or nonhot post-PIK3CA variants. Patients characterized by localized CMs and dilated veins visible on skin and MRI (white arrows). (a) Patients with smaller lesions and less prominent veins. (b) Patients with more extensive lesions and strongly prominent veins. (c) Progression of lesion in individual 2 from the age 7 to the age of 21 year: veins became more prominent and dilated, and CM turned from reddish to purplish color. (d) MRI (fat suppression sequence, 1.5T) of the lower limbs of patients 4, 5, and 7 showing hyperintense slow-flowing blood in dilated veins of the subcutaneous tissues. All subjects or their parent/guardian included in this study consented to publication of the images shown in this figure. CM, capillary malformation; CMDV, capillary malformation with dilated veins; MRI, magnetic resonance imaging. |
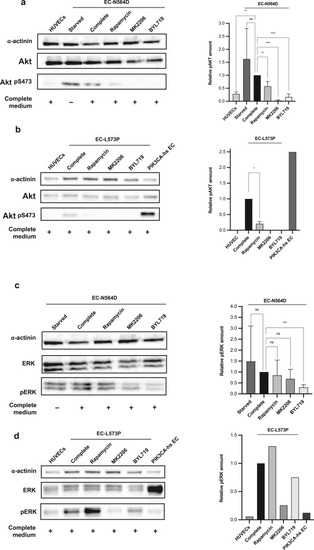
Western blot analysis of Akt and ERK phosphorylation and treatment with PI3K pathways inhibitors. (a) Patient-derived EC-N564D display Akt phosphorylation. pAkt is decreased after treatment with rapamycin and BYL719 (48 h) or MK2206 (24 h). (b) Patient-derived EC-L573P display Akt phosphorylation. pAkt is decreased after treatment with rapamycin and BYL719 (48 h) or MK2206 (24 h). (c) Patient-derived EC-N564D show ERK phosphorylation. pERK is decreased upon treatment with BYL719 but not with rapamycin or MK2206. (d) Patient-derived EC-L573P show ERK phosphorylation. pERK is decreased upon treatment with BYL719 and MK2206 but not with rapamycin. α-Actinin was used as loading control. PIK3CA-hs ECs are primary cells from a patient with CLVM (H1047R PIK3CA mutation). Error bars are shown as measure of variability and represent the SD. Experiments were repeated n = 5 times for EC-N564D cells. Owing to a shortage of surgical resected tissue and limited number of viable EC-L573P passages, Akt/pAkt and ERK/pERK were repeated n = 2 and n = 1 times, respectively. Akt, protein kinase B; CLVM, capillaro–lymphatico–venous malformation; EC, endothelial cell; ERK, extracellular signal–regulated kinase; h, hour; hs, hotspot; ns, not significant; pAkt, phosphorylated protein kinase B; pERK, phosphorylated extracellular signal–regulated kinase; PI3K, phosphoinositide 3-kinase. |
Western blot analysis of Akt and ERK phosphorylation and treatment with PI3K pathways inhibitors. (a) Patient-derived EC-N564D display Akt phosphorylation. pAkt is decreased after treatment with rapamycin and BYL719 (48 h) or MK2206 (24 h). (b) Patient-derived EC-L573P display Akt phosphorylation. pAkt is decreased after treatment with rapamycin and BYL719 (48 h) or MK2206 (24 h). (c) Patient-derived EC-N564D show ERK phosphorylation. pERK is decreased upon treatment with BYL719 but not with rapamycin or MK2206. (d) Patient-derived EC-L573P show ERK phosphorylation. pERK is decreased upon treatment with BYL719 and MK2206 but not with rapamycin. α-Actinin was used as loading control. PIK3CA-hs ECs are primary cells from a patient with CLVM (H1047R PIK3CA mutation). Error bars are shown as measure of variability and represent the SD. Experiments were repeated n = 5 times for EC-N564D cells. Owing to a shortage of surgical resected tissue and limited number of viable EC-L573P passages, Akt/pAkt and ERK/pERK were repeated n = 2 and n = 1 times, respectively. Akt, protein kinase B; CLVM, capillaro–lymphatico–venous malformation; EC, endothelial cell; ERK, extracellular signal–regulated kinase; h, hour; hs, hotspot; ns, not significant; pAkt, phosphorylated protein kinase B; pERK, phosphorylated extracellular signal–regulated kinase; PI3K, phosphoinositide 3-kinase. |
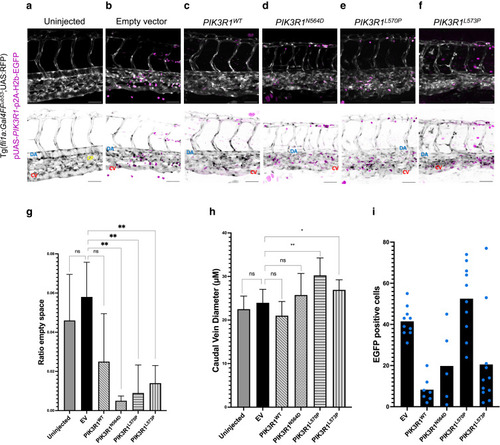
Endothelial-specific overexpression of mutated PIK3R1 in Tg(fli1a:Gal4FFub53;UAS:RFP)-positive zebrafish embryos. Normal and inverted images are shown. EGFP+ cells (magenta) contain the injected plasmid. CV (red), DA (yellow), and CP (blue) are shown. (a) Embryos with normal development of trunk vasculature. (b, c) Embryos injected with pUAS-p2A-H2b-EGFP (EV) and pUAS-PIK3R1WT-p2A-H2b-EGFP: normal development of trunk vasculature. (d–f) Embryos injected with pUAS-PIK3R1-p2A-H2b-EGFP expressing mutated PIK3R1: CV enlargement and CP disruption. (g) Quantification of area between CV and DA occupied by the capillary bed: ratio between intravessel and intervessel space. (h) Quantification of CV diameter. (i) Quantification of plasmid integration rate in zebrafish endothelium: EGFP+ cells found in capillary–venous plexus. Plotted are averages normalized on the number of embryos for each condition. Each blue dot corresponds to 1 embryo. Bar = 50 μM. Error bars are shown as measure of variability and represent the SD. Number of biological replicates: uninjected, n = 19; EV, n = 10; PIK3R1WT, n = 9; PIK3R1N564D, n = 4; PIK3R1L570P, n = 8; and PIK3R1L573P, n = 9. Embryos in which the CV was not readily distinguishable were discarded. CV, caudal vein; CP, capillary plexus; DA, dorsal aorta; EV, empty vector; ns, not significant. |
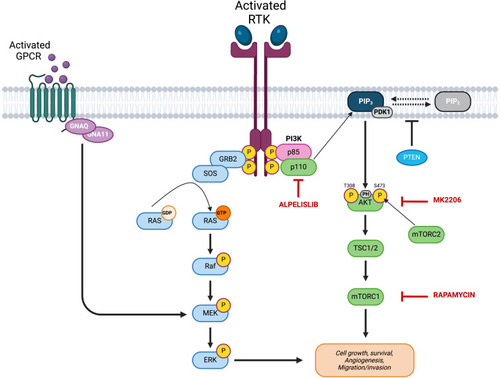
PI3K–Akt–mTOR signaling and RAS–RAF–MAPK signaling in vascular anomalies. Inhibitors of the signaling pathway are shown in red: PIK3CA inhibitor alpelisib (BYL719), Akt inhibitor MK-2206, and mTOR inhibitor rapamycin (sirolimus). Akt, protein kinase B; ERK, extracellular signal–regulated kinase; MEK, MAPK/extracellular signal–regulated kinase; PI3K, phosphoinositide 3-kinase. |
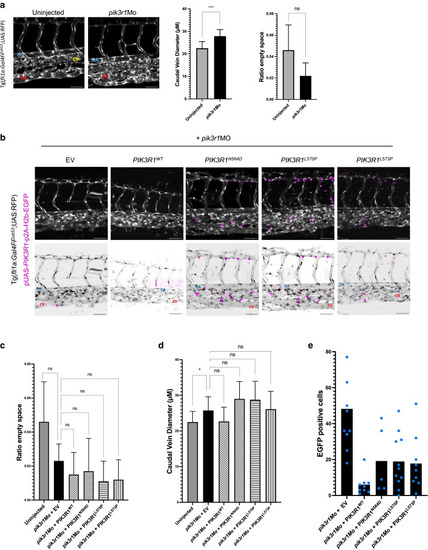
Knockdown and rescue of PIK3R1 expression in Tg(fli1a:Gal4FFub53;UAS:RFP)-positive zebrafish embryos. Normal and inverted images are shown. EGFP+ cells (magenta) integrated injected plasmid. CV (red), DA (yellow), CP (blue) are shown. (a) Embryos injected with spliced pik3r1Mo and uninjected control. Increased CV diameter but no CP disruption as effect of PIK3R1 knockdown is shown. (b) Embryos injected with pik3r1Mo and pUAS-p2A-H2b-EGFP (EV) or pUAS-PIK3R1-p2A-H2b-EGFP (wt/mutated) fail to rescue phenotype given by pik3r1Mo knockdown. (c, d) Quantification of CV diameter and area in between CV and DA, occupied by capillary bed, shows no difference when knockdown rescued, whether wt or mutant PIK3R1 expressed. (e) Quantification of plasmid integration rate in zebrafish endothelium: number of EGFP+ cells found in capillary–venous plexus. Plotted averages normalized on number of embryos per condition. Each blue dot corresponds to 1 embryo. Bar = 50 μM. Error bars are shown as measure of variability and represent the SD. Number of biological replicates: uninjected (n = 19), pik3r1Mo (n = 29), EV+ pik3r1Mo (n = 10), PIK3R1WT + pik3r1Mo (n = 5), PIK3R1N564D (n = 14), PIK3R1L570P + pik3r1Mo (n = 14), and PIK3R1L573P + pik3r1Mo (n = 9). Embryos in which the CV was not readily distinguishable were discarded. CP, capillary plexus; CV, caudal vein; DA, dorsal aorta; EV, empty vector; ns, not significant; wt, wild type. |
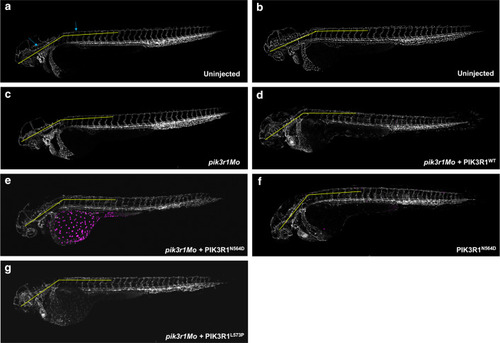
Overview (×10) of zebrafish embryos at 48–54 hpf. In yellow, lines indicating the angle between the head and the neck of the fish serve as a reference for determining its developmental stage (Kimmel et al, 1955). Notably, neither morphants nor mutant fish exhibited any indication of developmental delay. hpf, hours post fertilization. |
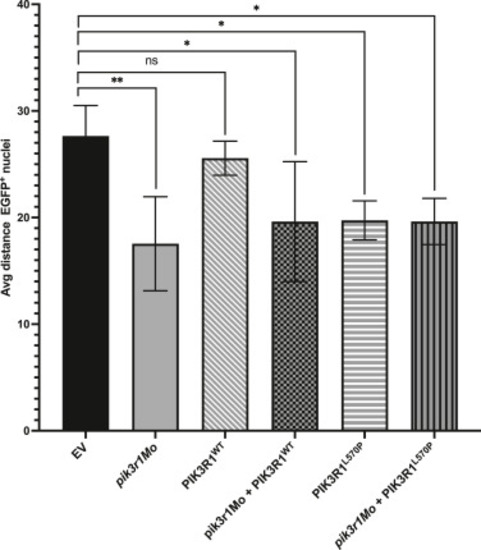
Measurement of the average distance between neighboring nuclei to assess cell size. In morphant as well as in mutant fish, cell size was significantly reduced compared with that in EV-injected control fish. This was not the case for overexpressing PIK3R1WT, which were not significantly smaller than EV-injected fish. EV, empty vector; ns, not significant. |