
|
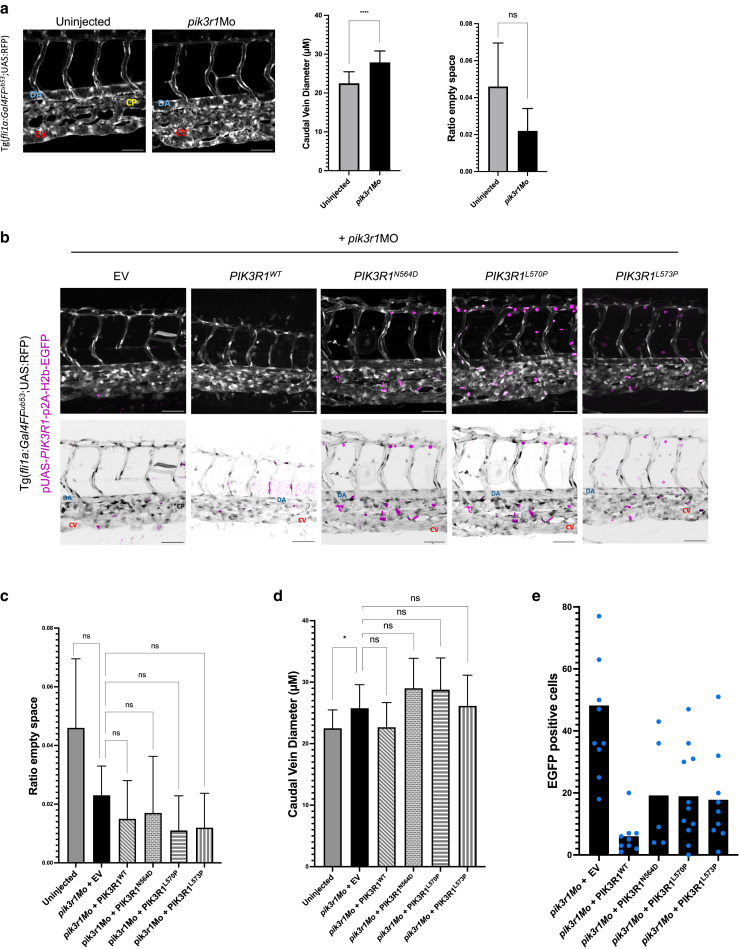
Fig. Supp 1 Knockdown and rescue of PIK3R1 expression in Tg(fli1a:Gal4FFub53;UAS:RFP)-positive zebrafish embryos. Normal and inverted images are shown. EGFP+ cells (magenta) integrated injected plasmid. CV (red), DA (yellow), CP (blue) are shown. (a) Embryos injected with spliced pik3r1Mo and uninjected control. Increased CV diameter but no CP disruption as effect of PIK3R1 knockdown is shown. (b) Embryos injected with pik3r1Mo and pUAS-p2A-H2b-EGFP (EV) or pUAS-PIK3R1-p2A-H2b-EGFP (wt/mutated) fail to rescue phenotype given by pik3r1Mo knockdown. (c, d) Quantification of CV diameter and area in between CV and DA, occupied by capillary bed, shows no difference when knockdown rescued, whether wt or mutant PIK3R1 expressed. (e) Quantification of plasmid integration rate in zebrafish endothelium: number of EGFP+ cells found in capillary–venous plexus. Plotted averages normalized on number of embryos per condition. Each blue dot corresponds to 1 embryo. Bar = 50 μM. Error bars are shown as measure of variability and represent the SD. Number of biological replicates: uninjected (n = 19), pik3r1Mo (n = 29), EV+ pik3r1Mo (n = 10), PIK3R1WT + pik3r1Mo (n = 5), PIK3R1N564D (n = 14), PIK3R1L570P + pik3r1Mo (n = 14), and PIK3R1L573P + pik3r1Mo (n = 9). Embryos in which the CV was not readily distinguishable were discarded. CP, capillary plexus; CV, caudal vein; DA, dorsal aorta; EV, empty vector; ns, not significant; wt, wild type.